
Assessing the impact of extreme heatwaves and urban-rural climate disparities on building cooling energy demand of public rental housing in Hong Kong
Guanli Feng, Pengyuan Shen, Shupeng Zhou, Shaochen Wang, Xing Zheng
2026
Energy
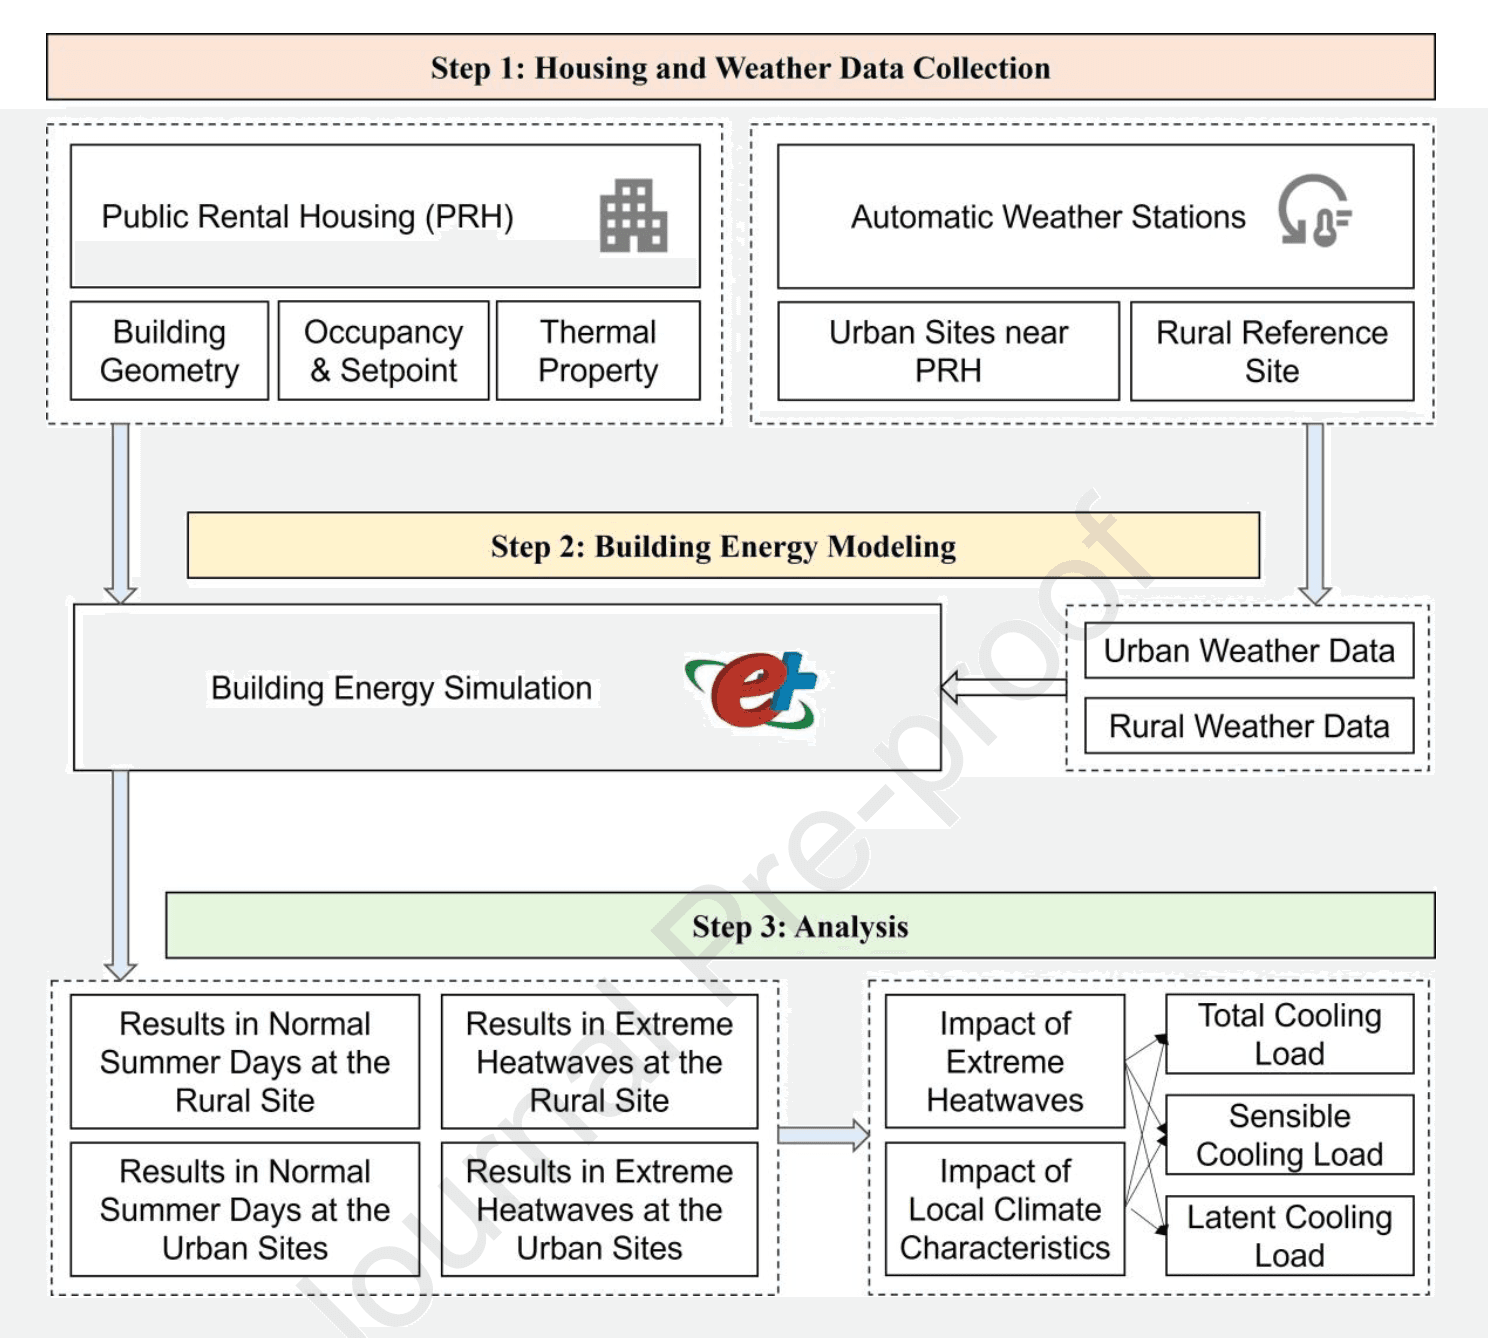
Fig. 1. Research Framework
Summary
This study uses EnergyPlus and 2022–2024 measured urban-rural meteorological data to simulate cooling loads of Hong Kong public rental housing under extreme heatwaves and regular summers. Obvious urban heat and moisture island effects are captured: urban total cooling loads peak 17.4% higher at night but drop 7.4% in daytime compared with rural sites. Sensible cooling load is mainly driven by air temperature, while latent load responds to dew point. Top floors consistently demand more cooling energy, delivering insights on building climate adaptation for high-density humid metropolises.
Abstract
Urban building energy demand under heatwaves is a rising concern, which is affected by local climate conditions. This study examines how extreme heatwaves and urban–rural climate differences affect cooling energy demand in public rental housing (PRH) in Hong Kong during 2022–2024. Four typical PRH sites were selected, three on the Kowloon Peninsula and one on a built-up island, and analyzed using building energy modeling driven by locally measured urban weather data and reference rural site weather data. Weather data indicate that urban–rural air and dew point temperature differences intensify during extreme heatwave (EH) versus normal summer (NS) days. The urban-rural difference in daily accumulated total cooling load intensity (CLtot) varies by urban site location, ranging from 3.8% lower to 4.0% higher in urban sites than the rural reference sites in EH days. A diurnal pattern is observed: At night (23:00 to 06:00), the accumulative total cooling load intensity is mostly higher than that from the reference rural site, reaching up to 17.4% higher in EH days and 24.3% higher in NS days. During the remainder of the day (07:00–22:00), the urban site generally results in a lower total cooling load intensity, up to 7.4% lower in EH days and 6.5% lower in NS days, than that from the reference rural site. Sensible cooling load is primarily associated with air temperature, whereas latent cooling load exhibits location-dependent responses to dew point temperature.
1. Introduction
Anthropogenic climate change is intensifying numerous weather and climate extremes across the globe. According to the Intergovernmental Panel on Climate Change (IPCC), the period between 2010 and 2019 marked the highest decadal greenhouse gas (GHG) emissions ever documented. This trajectory is fundamentally altering global climate patterns, leading to an anticipated rise in the regularity of extreme weather events, including heatwaves [1]. These climatic pressures are often intensified by the morphological and thermal characteristics of the built environment, manifested by the Urban Heat Island (UHI) effect [2-4], Urban Cool Island (UCI) effect [4], and Urban Moisture and Dry Islands (UMI and UDI) effect [5, 6]. The temperature differential may amplify climate change and heatwaves in metropolitan areas, thereby affecting the energy demand for buildings [7-10]. In contrast, rural areas, while still subject to global climate change, typically experience less thermal amplification, leading to different energy use patterns and adaptation challenges [11-13]. This urban-rural dichotomy necessitates the development of tailored strategies for climate resilience.
Situated along the southern Chinese coastline, Hong Kong is defined by a humid subtropical environment [14]. This city faces challenges in energy efficiency and sustainable building management, exacerbated by its persistently humid conditions, exceptionally high population density, and a vast, aging building stock [15, 16]. In response to the substantial share of total urban energy demand and carbon emissions attributed to the building stock, the government announced Hong Kong's Climate Action Plan 2050 for carbon neutrality, including strategies to improve the energy efficiency of buildings to reduce the energy demand [17]. . Among all the residential building types, Hong Kong’s public rental housing (PRH) plays a crucial role as it accommodates approximately 2.09 million residents, accounting for about 28% of the total population in Hong Kong [18]. This highlights the significance of studying how climate change influences the cooling energy demand of PRH.
As global climate shifts, sustained episodes of extreme thermal intensity across vast geographic areas have emerged as a critical point of concern. These prolonged heat events represent a growing threat to regional stability and public health [19]. The frequency and severity of heatwaves are increasing worldwide. In particular, extreme heatwave events were found to demonstrate more notable changes throughout the 1991–2020 interval, surpassing the trends observed in previous years [20]. The extreme warmth during heatwaves could significantly affect the energy consumption of buildings [19, 21, 22]. One of the major consequences is the significantly increasing air-conditioning (AC) load for space cooling [23]. The share of energy use attributed to air-conditioning in residential buildings rose from 23% in 2012 to 27% in 2022 [24]. In Hong Kong, the impacts on urban microclimate are further intensified due to amplified Urban Heat Island (UHI) phenomena within the distinctive highdensity spatial configurations [25], characterized by high-rise buildings in urban areas, street canyons with high aspect ratios, limited green spaces, and extensive impervious surfaces [4]. The impact of UHI can contribute to a rise in building cooling energy demand. Recent studies revealed a substantial positive correlation between daytime UHI effect and building cooling load [26]. The synergetic effect of UHI and heatwaves can further amplify urban overheating and increase building cooling load [19, 27].
Climate conditions in urban and rural areas exhibit significant disparities. Urban areas often experience more severe heatwaves than rural areas [28], which further increases the building cooling load [21]. Apart from the impact of heatwaves, the urban-rural disparity in building cooling loads can also widen as the intensity of the Urban Heat Island (UHI) effect increases [21, 29]. Each increase in the UHI effect can raise cooling energy consumption by approximately 7.9% in summer and 16.1% in transitional seasons [30]. In Hong Kong, the UHI intensity in the urban center can be greater than [31]. This difference has significant implications for building energy consumption, where heatwaves are growing more frequent and severe due to climate change. Li et al. utilized Cooling Degree Hours (CDH) to quantify climate-driven cooling demand, comparing urban and suburban data across several regions, including Hong Kong [32]. Their study found that cooling loads have been increasing annually, with urban cooling loads in Hong Kong approximately 12% higher than those in rural areas.
Numerous studies used building energy modeling (BEM) to evaluate the energy use of public rental housing in Hong Kong [14, 26, 30, 33-39]. Although these studies provide valuable insights into energy patterns and retrofits, they are constrained by the spatial and temporal resolution of weather datasets. BEM relies heavily on accurate weather inputs, including temperature, humidity, solar radiation, and wind speed, as essential inputs. The importance of weather data has been shown in BEM simulations in different climate regions [40-46]. Previous studies on public rental housing (PRH) in Hong Kong typically rely on either outdated local weather datasets—sourced from the Hong Kong Observatory or automatic weather stations located at sites such as the airport—or on Typical Meteorological Year (TMY) datasets as inputs for BEM [33, 34, 47-49]. TMY derived from historical data can also become outdated over time, making it inadequate for representing recent weather conditions [44, 50- 52]. Moreover, TMY data do not represent the specific microclimatic conditions at the exact location of the PRH buildings, potentially affecting the estimation of cooling demand differences.
This reliance on generalized datasets is particularly problematic when predicting the cooling load in air conditioning systems, which comprises two main components: sensible cooling, driven by air temperature, and latent cooling, which accounts for the energy needed to remove moisture from the air [53, 54]. Maia-Silva et al. highlighted that rising temperatures are associated with increased humidity in climate change, and the combination of increased air temperature and humidity could significantly increase heat stress and electricity demand during extreme heat events [55]. Cao et al. proposed a novel index combining air temperature and relative humidity to examine how latent cooling demand responds to variations in temperature and humidity across China’s diverse climate regions [56]. As a result, this index shows a strong relationship with the examined latent cooling load. Their findings also indicate that air temperature is not sufficient to characterize the climate sensitivity of cooling load [55]. Meanwhile, a study by Kheiri et al. revealed that different moisture levels can significantly impact building energy consumption [57]. Aside from the UHI effect, the urban moisture island (UMI) effect is also crucial to building cooling load. The UMI effect has been found to increase latent cooling demand in summer in residential buildings in Hong Kong by up to 96% [6]. However, most BEM studies on PRH in Hong Kong only consider the total cooling load, without separately analyzing sensible and latent components. Multiple studies have analyzed both components to understand the impact of urban microclimate [19, 54, 58]. However, limited attention has been paid to how urban–rural climatic differences influence both sensible and latent cooling loads under extreme heatwave and how these responses vary spatially within a city.
The present study intends to address the following questions: (1) To what extent do urban–o rural climate disparities influence the sensible and latent cooling loads of PRH in the subtropical high-density city Hong Kong? (2) How does the urban–rural contrast in cooling energy demand during EH and NS days vary by location, time of day, and floor level?r
Numerical simulations driven by in-situ measured weather data are employed to investigate the impact of urban-rural weather differences on the cooling load of PRH buildings in Honga Kong. The remaining article is organized as follows: The methodology is illustrated in Sectionn 2, including PRH site and building information, weather data generation, and BEM settings.u Section 3 provides the results of climate characteristics and cooling load performance. The key findings and conclusions are discussed in Sections 4 and 5, respectively.
2. Methodology

Figure 1 Research Framework
The present study involves three stages. First, measured weather data from weather stations in urban and rural sites were collected and converted into corresponding weather files for BEM. In the second stage, these weather files were used in EnergyPlus to model building energy consumption under different scenarios. Specifically, simulations were run for both normal summer days and extreme heatwave days at the rural reference site and urban sites (the definitions of normal summer days and extreme heatwave days will be given in Section 2.3). In the final stage, the simulated results of climate characteristics and cooling loads were compared to evaluate the impact of heatwaves on urban climate and building energy use.
2.1 Data Collection
2.1.1 Public rental housing
The present study focuses on PRH buildings built around the year 2000 across different areas in Hong Kong. Four typical PRH estates were selected as case studies (Figure 3), reflecting different urban microclimate scenarios with varying UHI intensities at the Tertiary Planning Unit scale, based on the classification in Ref [26]. Three are located in urban areas on the Kowloon Peninsula: (i) Hoi Fu Court in Mong Kok, Yau Tsim Mong District; (ii) Chung On Estate in Ma On Shan, Sha Tin District; (iii) Kwong Ming Court in Junk Bay, Sai Kung District; The other one is on an island but within a built-up town area, i.e., (iv) Nga Ning Court in Cheung Chau, Islands District. Table 1 shows the information about selected PRH estates [59]. All the selected buildings are of Harmony block type due to their high prevalence amongst newer PRH estates [37]. The typical plans of buildings are shown in Figure 2 [60].
Table 1
Information on selected PRHs


Figure 2 Typical floor plans of (a) Hoi Fu Court, (b) Kwong Ming Court, (c) Chung On Estate, and (d) Nga Ning Court. Plans are not drawn to the same scale.

Figure 3 Locations of selected PRHs and automatic weather stations. The zoomed-in locations of each PRH site are not drawn to the same scale.
2.1.2 Weather data
Weather data from 2022 to 2024 were obtained from the Hong Kong Observatory, measured by the nearest automatic weather stations to the selected PRH estates, as the updated source of climate inputs to represent the accurate urban microclimate information for BEM. The distance between the weather stations and the selected PRH estates is less than 3 km (Figure 3). In the present study, Ta Kwu Ling, a typical rural site, was selected as a reference site to retrieve rural weather data in Hong Kong for urban-rural comparative analysis, consistent with early studies [61, 62].
The meteorological parameters include air temperature, humidity, mean sea level pressure, solar radiation, wind speed, wind direction, rainfall, etc. The information about the weather station is detailed in Table 2. Note that solar radiation data are only available at King’s Park (KP) in the Hong Kong Observatory datasets. Global solar radiation, direct normal radiation, and diffuse solar radiation at KP were collected and applied to all sites.
Table 2
Information on the measurement of the local weather data [63]
- WS - Wind Speed; WD - Wind Direction; T - Temperature; RH – Relative Humidity; P – Mean Sea Level Pressure; R – Rainfall; SR – Solar Radiation
Weather data with all meteorological parameters was adopted to develop the annual EPW files as input for BEM from 2022 to 2024. Dew point temperature in EPW files was calculated based on dry bulb temperature, relative humidity, and atmospheric pressure. Since atmospheric pressure data for JKB is unavailable, the atmospheric pressure data from the Hong Kong Observatory weather station (HKO), the closest station containing atmospheric pressure data, was used for Kwong Ming Court.
2.2 Building energy modeling
EnergyPlus, a prominent open-source building energy simulation architecture, was employed in the present study. The study period for the 3 years is from June 1st to September 30th. The parameters of BEM for building geometry, thermal properties, HVAC system and occupancy schedules were adopted from previous studies [14, 19, 60, 64-69]. The specifications of the energy model are further elucidated within the following subsections:
2.2.1 Building geometry and material settings
The information on building geometries, including physical parameters, building components, and material properties, is listed in Table 4. The floor height of all buildings was set to 2.7 m [65]. Total occupied floor area, air-conditioned area, and window-to-wall ratio were calculated from building geometries based on floor plans from the Hong Kong Housing Authority (HKHA) [60]. Table 3 also shows the building components and material properties applied to the PRH buildings from a typical model according to the characteristics of the original construction [66, 68]. The PRH buildings investigated in the present study were completed between 1996 and 2001 and adopted similar material properties and construction codes to minimize the influence of building-specific factors.
BEM costs a massive computational time with thousands of air-conditioned zones on all floors over a 35-storey building. Therefore, simplification has been widely adopted by incorporating typical floors in building energy models [14, 33]. To reduce the number of airconditioned zones for efficient simulation while ensuring accuracy, three representative residential floors (bottom floor, middle floor, top floor) were modelled with complete room layouts for each PRH building. Note that the bottom floors took the actual second level of each PRH building, since the actual first level is used for public amenities.
The building energy model also includes surrounding buildings as shading elements. Ground surface temperature data used in EnergyPlus simulation were retrieved from the fifthgeneration ECMWF atmospheric reanalysis (ERA5) to more accurately simulate the heat flux of the bottom floor [70]. Building geometries of each PRH building in BEM are presented in Table 3.
Table 3 Building geometries of selected PRH buildings.

Table 4
Building physical parameters, building components, and their properties in the BEM.
2.2.2 Occupancy schedules
The cooling setpoint is set to for all the air-conditioned rooms in the PRH buildings, following Ref. [69]. It is also assumed that AC operates when rooms are occupied. During the AC operation period, all the windows are closed. The cooling schedules are based on an onsite survey conducted for the PRH buildings in Hong Kong [14], which provides the schedules of all the units consisting of three types of rooms in the selected PRH buildings in this study: studio unit (a 1-person or 2-person suite), living room, and bedroom. Detailed occupancy schedules are displayed in Figure 4.
(a)

(b)

Figure 4 Occupancy schedule of Studio, living room, and bedroom (a) on weekdays and (b) weekends. “1” indicates full air-conditioning occupancy during this hour, while “0” indicates no occupancy
An Ideal Loads Air System [67] was adopted in EnergyPlus to evaluate the cooling demand of the PRH buildings. At each simulation timestep, EnergyPlus calculates the sensible and latent cooling loads required to maintain the indoor cooling setpoint under the prescribed weather conditions, building characteristics, and occupancy schedules. The total cooling load intensity (CLtot) reported in this study is the sum of sensible cooling load intensity (CLs) and latent cooling load intensity (CLl).
2.2.3 Analysis methods
We defined two categories of weather days during the summer periods (June 1st to September 30th): extreme heatwave (EH) days and normal summer (NS) days (reference days).
A day with the maximum hourly temperature exceeding [71] at the rural reference site is considered an extremely overheat day. An extreme heatwave event is defined as a sequence of at least three consecutive extremely overheat days. Days during such extreme heatwave events are defined as EH days. By comparison, an NS day must meet all the following three criteria: (1) this day is not a rainy day; (2) the diurnal temperature range (DTR) measured at the rural reference site must exceed the percentile of DTR for the entire study period to avoid overcast days, as low DTR values typically indicate cloudy and overcast conditions [72]; (3) daily cumulative precipitation must be less than 0.1 mm to exclude rainy days [19]; The
Table 5
EH days, NS days, and the period of heatwave events in the study period
3. Results
3.1 Weather conditions: air temperature and dew point temperature
In this section, the weather conditions were compared across four scenarios: NS days at urban sites, EH days at urban sites, NS days at the rural reference site, and EH days at the rural reference site. The meteorological parameters include air temperature, dew point temperature, and wind speed.
Figure 5 illustrates the air temperature (Ta) averaged for each hour across all days.
Significant differences are found across all the scenarios and locations. Daily fluctuations are generally less pronounced at urban sites than at rural reference sites, with greater variation observed during EH days compared to NS days. For instance, the DTR in EH days and NS days at SHA are and , while the DTR at the rural reference site in EH days and NS days are and . As expected, difference between EH days and NS days in the daytime is found to be more pronounced than that in the nighttime.


Figure 5 averaged for each hour across all the days during the study period, measured by automatic weather stations in (a) SHA, (b) KP, (c) JKB, and (d) CCH. The solid lines denote the average values, while the shaded areas represent the standard deviations for the analyzed days over the study period. The rural reference data is added.
The peak values (Figure 5) are similar across sites, ranging from to in NS days and from to in EH days. Overall, at night and in the early morning, in urban areas is higher than in the rural reference site. While from the beginning of daytime, at the rural site increases faster than in the urban sites and reaches higher peak values. This difference may be attributed to the shading provided by high-density buildings, which helps reduce heat gain. The magnitude of urban-rural air temperature differences varies across different locations. For example, the urban cool island (UCI) effect during daytime is found to be more pronounced in KP than in other sites in typical urban areas (SHA and JKB), in the f averaged diurnal variation in both NS days and EH days. The UHI effect during nighttime iso exacerbated by heatwaves, as the urban-rural difference is higher in EH days than in NSo days in all locations.
Figure 6 shows the daily variation of dew point temperature , which displays a distinct pattern from profiles. Overall, at urban sites is slightly higher than the ruralr reference site during EH days and NS days, except at KP. For SHA, JKB, and CCH, the magnitude of the UMI effect is greater in EH days than in NS days. The maximum daily urban-a rural differences in the 3 sites are fromn to in EH days and from to in NS days, respectively. CCH shows the highest urban-rural difference ofu in both EH days and NS days.
(c)
(d)


Figure 6 averaged for each hour across all the days during the study period measured by automatic weather stations in (a) SHA, (b) KP, (c) JKB, (d) CCH. The solid lines denote the average values, while the shaded areas represent the standard deviations for the analyzed days over the study period.
3.2 Diurnal profile of building cooling loads
Figure 7 shows the simulated hourly total cooling load intensity , and its two components: sensible cooling load intensity (CLs), and latent cooling load intensity (CLl), averaged for each hour across all days using urban and rural weather data for the four PRH cases. Urban weather data typically produces a higher than the rural weather data during the midnight hours. For example, for KP cases, from 23:00 to 06:00, the urban-rural difference in accumulative reaches up to 17.4% in EH days and 24.3% in NS days. In contrast, during the rest of the day (7:00 to 22:00), urban data tends to result in a lower , with the accumulative up to 7.4% in EH days and 6.5% NS days lower than the rural data. This urban-rural difference is mainly contributed by . In KP and CCH cases, daytime air temperatures at the rural reference site exceed those at the urban site due to reduced shading and stronger solar exposure, resulting in higher s during daytime hours. Consequently, despite higher nighttime air temperatures in urban areas, the daily accumulated cooling load may be comparable to or even lower than that in the rural reference site. For CCH case has a significantly higher value than the rural reference site from 7:00 to 22:00, while the urbanrural difference of in SHA, KP, and JKB is minimal. Notably, there is no cooling load between 8:00 and 11:00 due to the cooling schedule shown in Figure 6.
(a)

(d)

(b)

(e)

(c)


(g)


(h)

(k)

(i)


Figure 7 (a) (b) (c) and using weather data from urban and rural reference sites averaged for each hour across all EH days and NS days of SHA, (d-f) the same for KP, (g-i) the same for JKB, and (j-l) the same for CCH PRH cases. The solid lines denote the average values, while the shaded areas represent the standard deviations calculated over the study period.
3.3 Daily mean accumulative building cooling load intensity
Figure 8 illustrates the daily mean accumulative , and of the bottom floor, middle floor, and top floor in 4 scenarios, averaged across the days in the study period among different PRH cases. As shown in Figure 8 (a), the three-floor-averaged obtained from urban weather data in EH days is 4.0% and 1.3% higher than that using the rural weather data for SHA and JKB cases, respectively. This difference is more significant in NS days (6.4% and 3.1% higher for SHA and JKB cases, respectively). This is due to the significantly higher in SHA and JKB than in the rural site from 23:00 to 6:00, as shown in Figure 7 (a-c) and (g-i). In contrast, the KP and the CCH cases exhibit an opposite urban-rural difference in EH days, with urban lower than rural for KP case, and 3.8% lower than rural for CCH case. This is because of the lower urban than the rural from 7:00 to 22:00, as shown in Figure 7 (d-f) and (j-l). In NS days, the urban is 1.4% lower for KP case, and at the bottom and middle floors is generally close, while the top floor shows a tendency of higher cooling load demand. In urban sites, the daily mean accumulative at the top floor can reach up to 16.8% higher compared to the bottom floor in EH days and 18.8% higher in NS days.
Figure 8 (b) and Figure 8 (c) show the daily mean accumulative and CLl. In SHA, both the and align with the pattern of , showing a higher value compared to that using weather data in the rural site. While in JKB, higher and are observed compared to that using weather data in the rural site. For KP and CCH cases, when using rural weather data as BEM input, higher CLs and are observed for all floors compared to those using urban local weather data in EH days. However, when looking at the of CCH case, it is significantly higher in both EH days and NS days than that using rural weather data across all floors. This is because the higher is observed in the urban area despite the overall lower , as shown in Figure 6 (d).
(a)

(b)

(c)

Figure 8 Daily mean accumulative (a) (b) CLs, and (c) CLl of different floors in 4 PRH building cases for all scenarios. The vertical error bars denote the corresponding standard deviation.
3.4 Daily peak building cooling load intensity
Precise quantification of maximum daily refrigeration requirements is fundamental for both HVAC system sizing and resilient metropolitan energy governance, especially when extreme heatwaves place unprecedented stress on the power grid [19]. Figure 9 shows boxplots of daily peak cooling load intensity in all locations under 4 scenarios. As shown in Figure 9 (a), the median value of daily peak in SHA (6.5% in EH days and 3.2% in NS days) and CCH (9.3% in EH days and 22.6% in NS days) is higher than in the rural reference site, which is mainly contributed by shown in Figure 9 (c). In contrast, compared to the rural reference site, the median value of daily peak in KP is 8.9% lower in EH days and 8.4% lower in NS days. dominates the urban-rural disparities across different scenarios in SHA, KP, and JKB, as shown in Figure 9 (b).
(a)

(b)

(c)

Figure 9 Boxplots of hourly peak (a) total, (b) sensible, and (c) latent cooling load intensity of four PRH building cases across different scenarios. Each box represents the interquartile range, spanning from the percentile to the percentile of the data. The circle within each box indicates the median percentile), while the whiskers extend to the most extreme data points within 1.5 times the IQR from the lower and upper quartiles. Data points beyond this range are plotted individually as outliers.
3.5 Relationships of daily building cooling energy demand with and
The daily cumulative and generally demonstrate a positive nonlinear correlation with the daily mean and . Linear and various degrees of polynomial regression were used to fit the model to illustrate the relationships. Figure 10 illustrates the relationship between daily mean and daily mean accumulative in 4 PRH sites over the study period. The results in all 4 locations demonstrate a linear fit (CCH) or quasi-linear quadratic polynomial fit (SHA, KP, and JKB). The results for daily mean accumulative show that the model explains values ranging from 0.565 to 0.657, showing that the positive correlation between and is robust. For every increase of , the increase of ranges from 0.099 to 0.137 across different locations.
(a)

(b)

(c)

(d)

Figure 10 Relationships between daily mean and daily mean accumulative sensible cooling demands of four PRH cases: (a) SHA, (b) KP, (c) JKB, and (d) CCH.
Figure 11 demonstrates the relationship between daily mean and daily mean accumulative CLl. As a result, the overall ranges from 0.509 to 0.624 in different degrees of linear or polynomial models. The correlations between and are complicated in different locations and domains of . Overall, increases with from to . In SHA and KP, the increasing rate of fluctuates and could even fall to minus when is below . When is between and , every increase of can lead to a rise of CLl from 0.029 to 0.075 kWh/m2 across the 4 locations.
(a)


(c)

(d)

Figure 11 Relationships between daily mean and daily mean accumulative latent cooling demands of four PRH cases: (a) SHA, (b) KP, (c) JKB, and (d) CCH
3.6 Special EH event
An inspection analysis for a special EH event was conducted for an EH event at Chung On Estate, corresponding to SHA. Figure 12 shows the hourly profiles of , , and simulated using urban and rural weather data as input to BEM, along with and over 13 days from Aug to Aug , 2024. This period includes 3 pre-EH days, 7 EH days, and 3 post-EH days. In line with the observation in Figure 5a, at nighttime is higher in SHA than in rural areas, exhibiting the UHI effect, while a UCI effect is observed during most daytime hours. After the mid-point of this EH event, in the daytime is generally lower than in rural areas, indicating the urban cool island effect. , however, is generally higher during the entire selected EH event at SHA, showing a strong UMI effect.
Figure 12 (a) demonstrates the in this selected EH event, which is primarily influenced by . Overall, the pattern of closely follows that of . The result shows a higher cooling load in pre-EH days and a decline in the middle of this EH event. The variations of and are generally aligned, except for several time lags (e.g., 12:00 on Aug 13th) and abrupt changes of cooling load due to the absent occupancy from 7:00 to 11:00 of PRH buildings (as explained in section 2.2.2), occurring after 11:00 every day. Regarding the (as shown in Figure 12 (b)), the result at SHA is generally higher than that at the rural site, which aligns with the variation. Similar to , ΔCLl experiences time lags and abrupt changes, due to the absence of occupancy from 7:00 to 11:00 (e.g., 12:00 on Aug 12th).
For the total cooling load, higher demand is observed in SHA than in the rural reference site during pre-EH days and the early stage of the EH event, as shown in Figure 12 (c). During the post-EH days, the daytime cooling load becomes generally higher at the rural site. At night, the cooling load in SHA remains consistently higher than that in rural areas during the first 2 days, while afterwards the difference between SHA and the rural site becomes minimal at night. This time lag could result from the effect ofthermal inertia of PRH buildings and the prolonged heatwave.


Figure 12 Hourly profiles and their urban-rural differences of (a) & (b) & (c) total cooling load for Chung On Estate (SHA) from Aug 1st to Aug 13th, 2024. The red shaded periods denote the selected EH event days. The grey shaded periods denote nighttime hours from 18:00 to 06:00 the next day.
4. Discussion
4.1 Impact of heatwaves on building cooling load
The pronounced increase in during extreme heatwave (EH) periods is attributed to the rise in air temperature (Ta). Compared to normal summer (NS) days, the daily cumulative and peak cooling loads during extreme heatwave (EH) days are consistently higher. This pattern is evident in both urban and rural scenarios, though the magnitude of increase varies by site and weather conditions. The extended heatwaves and thermal inertia in building structures can influence passive thermal resilience [73], and have compounding effects where the daily cooling load varies differently from . To mitigate the impact of heatwaves, technologies like radiative cooling are considered to have great cooling potentials during summer for its reduction in solar heat gain [74, 75]. In the climate conditions of Hong Kong, a previous study showed that a highly reflective material can generate a significant cooling effect on humid days [76].
Notably, while are primarily driven by outdoor CLl appear more sensitive to the combination of internal moisture generation and elevated ambient humidity. CLl’s increase in EH days (compared to NS days) is smaller than that of yet it demonstrates a dynamic response to higher . While air temperature remains the primary factor in temperature-driven cooling demand, humidity plays a secondary yet non-negligible role in influencing total energy demand. The strong relationship between and suggests that urban heat mitigation strategies should consider both air temperature and moisture-related effects. For example, nature-based solutions such as urban greening can reduce ambient temperatures through shading and evapotranspiration [74, 75], yet their effects on local humidity warrant evaluation, especially in humid subtropical regions where latent cooling accounts for much of total cooling demand. Integrated assessment of temperature and humidity responses is essential for developing effective adaptation strategies.
The top floors consistently experience higher and compared to the middle and bottom floors, particularly under extreme heatwave (EH) conditions. They generally require more cooling energy to maintain the indoor primarily because of the greater heat gain through the exposed roof [77-79].
4.2 Urban-rural difference in building cooling load across locations
The urban-rural disparity in building cooling load reflects more than just a difference in —it underscores the influence of building form, surface materials, ventilation characteristics, and microclimatic feedbacks [80, 81]. In the present study, the simulations revealed clear evidence of the UHI and UMI effects across the studied locations. In Sha Tin (SHA) and Junk Bay (JKB), urban weather data inputs yielded higher daily mean accumulative than rural weather data inputs. The urban-rural gap is particularly evident at night, where retained urban heat limited cooling recovery, resulting in prolonged air-conditioning operation.
Notably, the site-specific variation in cooling load trends, particularly the reversal of humidity seen in Cheung Chau (CCH), suggests that urban-rural comparisons cannot rely on alone. For higher results are observed in Sha Tin (SHA) and Junk Bay (JKB) when compared to the rural area, while in KP and CCH, the results are higher in rural areas due to the lower compared to SHA and JKB. The latent cooling load increases in CCH, possibly driven by local moisture accumulation or sea breeze-induced humidity.
4.3 Impact of occupancy on building cooling load
Occupancy behavior introduces a dynamic overlay to the patterns of cooling energy use [82, 83]. While temperature and humidity define the baseline load, it is the interaction with occupancy schedules and activity levels that sharpens the diurnal peaks observed in the simulated cooling load. The simulations incorporate dynamic schedules that reflect different occupancy levels during weekdays and weekends across unit types. The consistent rise in cooling load after 11:00 across all scenarios aligns with the appearance of occupancy. These findings underscore that occupancy schedules play a critical role in determining the actual cooling load profiles. Thus, they significantly amplify the impact of external climatic conditions. Dynamic variations in occupant behavior, appliance usage, and adaptive comfort responses can be incorporated. [84, 85].
4.4 Limitations and perspectives
Despite the robustness of this study in integrating measured weather data and detailed building energy modeling, several limitations should be acknowledged. First, the analysis focuses on four urban locations, representing typical conditions in Hong Kong. The variation in results across these sites indicates that a broader sample of PRH sites in urban areas is needed to enhance the generalizability of the conclusions. Note that expanding this work would require access to additional localized weather data for each new site. Second, this study used weather data in a 3-year period. Future work should consider using weather data over a longer period. In addition, the simulations adopted a fixed schedule and cooling setpoint [69] to ensure consistent comparisons across scenarios. The present results underscore that occupancy schedules play a critical role in determining the actual cooling load profiles. Future studies can dynamically simulate variations in occupant behavior, appliance usage, and adaptive comfort responses.
5. Conclusion
This study provides a systematic assessment of how extreme heatwaves and urban microclimate conditions affect the building cooling energy performance of public rental housing (PRH) in Hong Kong. Four typical PRH sites were selected as urban cases; three are located in urban areas on the Kowloon Peninsula, and one is on an island within a built-up town area. The analysis is based on building energy modeling using local measured weather data at urban sites and measured weather data at the reference rural site. The main findings can be summarized as follows:
⚫ For the Extreme Heatwave (EH) events observed during the 2022–2024 study period, the urban–rural air temperature (Ta) difference is more pronounced during EH days than during Normal Summer (NS) days. At most urban sites, dew point temperature is higher than the reference site. This Urban Moisture Island (UMI) effect becomes more pronounced during the observed EH events.
The urban-rural difference in daily accumulated total cooling load intensity varies by urban site locations, ranging from 3.8% lower to 4.0% higher in urban sites than the rural reference sites in EH days. A diurnal pattern is observed: At night (23:00 to 06:00), accumulative total cooling load intensity is mostly higher than that from the reference rural site, reaching up to 17.4% higher in EH days and 24.3% higher in NS days. During the remainder of the day (07:00–22:00), the urban site generally results in a lower total cooling load intensity, up to 7.4% in EH days and 6.5% in NS days, lower than that from the reference rural site. The daily accumulated shows a clear variation with floor level. Cooling load intensity at the bottom floor and the middle floor is generally similar. However, top floors require up to 16.8% (EH days) and 18.8% (NS days) more cooling load than bottom floors.
⚫ During EH days, the median values of daily peak across the four sites range from 8.9% lower to 9.3% higher than the rural reference. In NS days, this urban–rural contrast spans from 8.4% lower to 22.6% higher, reflecting stronger site-dependent dominance of either latent or sensible cooling load.
show a moderately strong linear or quasi-linear correlation ranges from 0.565 to 0.657) with across different locations, with an increase from 0.099 to 0.137 per day for every increase in In contrast, exhibits a more complex correlation with across different locations with varying increasing rates.
Occupancy schedules play a critical role in determining the actual cooling load profiles. The interaction between occupancy schedules and urban climate amplifies the impact of urban–rural climate differences on the overall cooling load.
The present study advances understanding of how extreme heatwaves and urban microclimate impact cooling energy demand in Hong Kong’s public rental housing. These findings highlight the importance of considering the impact of urban microclimate on both sensible and latent cooling loads and provide new insights into the spatiotemporal variability of urban climate impacts on residential buildings in high-density subtropical cities. Furthermore, the pronounced spatial and temporal variations observed highlight the heterogeneous nature of urban climate impacts on buildings in high-density subtropical cities. These insights contribute to a more comprehensive understanding of urban climate–building energy interactions and provide a scientific basis for climate-responsive urban energy planning and adaptation strategies under intensifying heatwave conditions.
Acknowledgment
This work was supported by a grant from National Natural Science Foundation of China (Project No. 52508141).
Declaration of Competing Interest
The authors declare that they have no known competing financial interests or personal relationships that could have appeared to influence the work reported in this paper.
Reference
[1] H. Lee et al., "IPCC, 2023: Climate Change 2023: Synthesis Report, Summary for Policymakers. Contribution of Working Groups I, II and III to the Sixth Assessment Report of the Intergovernmental Panel on Climate Change [Core Writing Team, H. Lee and J. Romero (eds.)]. IPCC, Geneva, Switzerland," pp. 1-34, 2023, doi: 10.59327/ipcc/ar6-9789291691647.001.
[2] K. Park, H.-G. Jin, and J.-J. Baik, "Contrasting interactions between urban heat islands and heat waves in Seoul, South Korea, and their associations with synoptic patterns," Urban Climate, vol. 49, 2023, doi: 10.1016/j.uclim.2023.101524.
[3] R. Sharston and M. Singh, "Urban morphology, urban heat island (UHI) and building energy consumption: A critical review of methods and relationships among influential parameters," Building Services Engineering Research & Technology, vol. 46, no. 4, pp. 561-584, 2025, doi: 10.1177/01436244251339727.
[4] C. Ren et al., "Investigating the urban heat and cool island effects during extreme heat events in high‐density cities: A case study of Hong Kong from 2000 to 2018," International Journal of Climatology, vol. 41, no. 15, pp. 6736-6754, 2021, doi: 10.1002/joc.7222.
[5] R. Du et al., "High-resolution regional modeling of urban moisture island: mechanisms and implications on thermal comfort," Building and Environment, vol. 207, 2022, doi: 10.1016/j.buildenv.2021.108542.
[6] X. Huang and J. Song, "Urban moisture and dry islands: spatiotemporal variation patterns and mechanisms of urban air humidity changes across the globe," Environmental Research Letters, vol. 18, no. 10, 2023, doi: 10.1088/1748-9326/acf7d7.
[7] X. Liu et al., "A novel quantitative method of heatwave classification for building resilience analysis," Sustainable Cities and Society, vol. 112, 2024, doi: 10.1016/j.scs.2024.105603.
[8] P. Shen et al., "Recent progress in building energy retrofit analysis under changing future climate: A review," 10.1016/j.apenergy.2025.125441.
[9] P. Shen and B. Yang, "Projecting Texas energy use for residential sector under future climate and urbanization scenarios: A bottom-up method based on twenty-year regional energy use data," Energy, vol. 193, 2020, doi: 10.1016/j.energy.2019.116694.
[10] P. Shen et al., "Climate adaptability of building passive strategies to changing future urban climate: A review," Nexus, vol. 2, no. 2, 2025, doi: 10.1016/j.ynexs.2025.100061.
[11] C. Yang, Y. Qin, H. Wu, Y. Zhao, and S. Che, "Urban park green spaces and their potential in regulating urban heat Island (UHI) effects in urban-rural gradient in Shanghai, China," Sustainable Cities and Society, vol. 129, 2025, doi: 10.1016/j.scs.2025.106467.
[12] S. Sun and K. Tong, "Rural-urban inequality in energy use sufficiency and efficiency during a rapid urbanization period," Applied Energy, vol. 364, 2024, doi: 10.1016/j.apenergy.2024.123133.
[13] S. Eugenio Pappalardo, C. Zanetti, and V. Todeschi, "Mapping urban heat islands and heat-related risk during heat waves from a climate justice perspective: A case study in the municipality of Padua (Italy) for inclusive adaptation policies," Landscape and Urban Planning, vol. 238, 2023, doi: 10.1016/j.landurbplan.2023.104831.
[14] H. Qin and W. Pan, "Energy use of subtropical high-rise public residential buildings and impacts of energy saving measures," Journal of Cleaner Production, vol. 254, 2020, doi: 10.1016/j.jclepro.2020.120041.
[15] S. Liu, Y. T. Kwok, K. K.-L. Lau, W. Ouyang, and E. Ng, "Effectiveness of passive design strategies in responding to future climate change for residential buildings in hot and humid Hong Kong," Energy and Buildings, vol. 228, 2020, doi:
10.1016/j.enbuild.2020.110469.
[16] S. Liu, Y. T. Kwok, K. K.-L. Lau, H. W. Tong, P. W. Chan, and E. Ng, "Development and application of future design weather data for evaluating the building thermal-energy performance in subtropical Hong Kong," Energy and Buildings, vol. 209, 2020, doi: 10.1016/j.enbuild.2019.109696.
[17] GovHK. "Climate Change." https://www.gov.hk/en/residents/environment/global/climate.htm#:~:text=In%202021 %2C%20the%20Government%20announced,goal%20of%20carbon%20neutrality%2 0before (accessed March 6, 2025).
[18] Hong Kong Housing Authority, "Report on Population and Households in Housing Authority Public Rental Housing," 2025. [Online]. Available: www.housingauthority.gov.hk/en/common/pdf/about-us/publications-andstatistics/PopulationReport.pdf.
[19] X. Yang et al., "How heat waves and urban microclimates affect building cooling energy demand? Insights from fifteen eastern Chinese cities," Applied Energy, vol. 384, 2025, doi: 10.1016/j.apenergy.2025.125424.
[20] L. Jiang et al., "Increased frequency and severity of global compound dry and heat wave 10.1016/j.jhydrol.2025.132857.
[21] F. Meng, L. Zhang, G. Ren, and R. Zhang, "Impacts of UHI on variations in cooling loads in buildings during heatwaves: A case study of Beijing and Tianjin, China," Energy, vol. 273, 2023, doi: 10.1016/j.energy.2023.127189.
[22] G. Aruta, F. Ascione, T. Iovane, and M. Mastellone, "Thermal resilience to climate change of energy retrofit technologies for building envelope," Energy, vol. 327, 2025, doi: 10.1016/j.energy.2025.136489.
[23] R. Du, C.-H. Liu, X. Li, and C.-Y. Lin, "Interaction among local flows, UHI, coastal winds, and complex terrain: Effect on urban-scale temperature and building energy consumption during heatwaves," Energy and Buildings, vol. 303, 2024, doi: 10.1016/j.enbuild.2023.113763.
[24] EMSD, "Hong Kong energy end-use data 2024," 2024. [Online]. Available: https://www.emsd.gov.hk/filemanager/en/content_762/HKEEUD2024.pdf.
[25] S. Liu, Y. T. Kwok, and C. Ren, "Investigating the impact of urban microclimate on building thermal performance: A case study of dense urban areas in Hong Kong," Sustainable Cities and Society, vol. 94, 2023, doi: 10.1016/j.scs.2023.104509.
[26] S. Liu, M. Cai, C. Ren, G. Chen, C. P. Nielsen, and H. Samuelson, "Urban heat island impacts on cooling energy demand of residential buildings at the city scale: a case study of Hong Kong," Energy, vol. 332, 2025, doi: 10.1016/j.energy.2025.137165.
[27] R. Paolini and M. Santamouris, Urban Climate Change and Heat Islands. 2023.
[28] Z. Qiao, N. Wang, J. Chen, X. Xu, L. Liu, and D. Han, "Understanding the differences in the contribution and impact of urbanization on urban warming during heatwave and non-heatwave periods in China," Journal of Cleaner Production, vol. 474, 2024, doi: 10.1016/j.jclepro.2024.143626.
[29] P. Shen, "Spatiotemporal mapping of urban air temperature and UHI under TMY condition: A reference station based machine learning approach," Energy and Buildings, vol. 343, 2025, doi: 10.1016/j.enbuild.2025.115923.
[30] Y. X. Ma and A. C. Yu, "Impact of urban heat island on high-rise residential building cooling energy demand in Hong Kong," Energy and Buildings, vol. 311, 2024, doi: 10.1016/j.enbuild.2024.114127.
[31] M. Hing Yim, W. Man Chi, and C. Cheuk Yin, "Spatial Variation of the Characteristics of Urban Heat Island Effect in Hong Kong," Journal of Civil Engineering and Architecture, vol. 5, no. 9, 2011, doi: 10.17265/1934-7359/2011.09.003.
[32] H. Li et al., "Relating three-decade surge in space cooling demand to urban warming," Environmental Research Letters, vol. 18, no. 12, 2023, doi: 10.1088/1748-9326/ad0a56.
[33] W. Pan, H. Qin, and Y. Zhao, "Challenges for energy and carbon modeling of high-rise buildings: The case of public housing in Hong Kong," Resources, Conservation and Recycling, vol. 123, pp. 208-218, 2017, doi: 10.1016/j.resconrec.2016.02.013.
[34] K. Gao, K. F. Fong, C. K. Lee, K. K.-L. Lau, and E. Ng, "Balancing thermal comfort and energy efficiency in high-rise public housing in Hong Kong: Insights and recommendations," Journal of Cleaner Production, vol. 437, 2024, doi: 10.1016/j.jclepro.2024.140741.
[35] C. Yu, J. Du, and W. Pan, "Improving accuracy in building energy simulation via evaluating occupant behaviors: A case study in Hong Kong," Energy and Buildings, vol. 202, 2019, doi: 10.1016/j.enbuild.2019.109373.
[36] K. W. Mui, L. T. Wong, M. K. Satheesan, and A. Balachandran, "A Hybrid Simulation Model to Predict the Cooling Energy Consumption for Residential Housing in Hong Kong," Energies, vol. 14, no. 16, 2021, doi: 10.3390/en14164850.
[37] Y. T. Kwok et al., "A comparative study on the indoor thermal comfort and energy consumption of typical public rental housing types under near-extreme summer conditions in Hong Kong," Energy Procedia, vol. 122, pp. 973-978, 2017, doi: 10.1016/j.egypro.2017.07.454.
[38] S. Liu, Y. Wang, X. Liu, L. Yang, Y. Zhang, and J. He, "How does future climatic uncertainty affect multi-objective building energy retrofit decisions? Evidence from residential buildings in subtropical Hong Kong," Sustainable Cities and Society, vol. 92, 2023, doi: 10.1016/j.scs.2023.104482.
[39] X. Chen, H. Yang, and K. Sun, "A holistic passive design approach to optimize indoor environmental quality of a typical residential building in Hong Kong," Energy, vol. 113, pp. 267-281, 2016, doi: 10.1016/j.energy.2016.07.058.
[40] F. Bre, R. M. e Silva Machado, L. K. Lawrie, D. B. Crawley, and R. Lamberts, "Assessment of solar radiation data quality in typical meteorological years and its influence on the building performance simulation," Energy and Buildings, vol. 250, 2021, doi: 10.1016/j.enbuild.2021.111251.
[41] A. M'Saouri El Bat, Z. Romani, E. Bozonnet, and A. Draoui, "Thermal impact of street canyon microclimate on building energy needs using TRNSYS: A case study of the city of Tangier in Morocco," Case Studies in Thermal Engineering, vol. 24, 2021, doi:
10.1016/j.csite.2020.100834.
[42] C. Chang, C.-Y. Chen, and T.-P. Lin, "Combining geographic information and climate data to develop urban building energy prediction models in Taichung, Taiwan," Sustainable Cities and Society, vol. 117, 2024, doi: 10.1016/j.scs.2024.105949.
[43] R. F. De Masi, A. Gigante, S. Ruggiero, and G. P. Vanoli, "Impact of weather data and climate change projections in the refurbishment design of residential buildings in cooling dominated climate," Applied Energy, vol. 303, 2021, doi: 10.1016/j.apenergy.2021.117584.
[44] X. Zheng et al., "Reanalysis-data-based approach to generate urban local weather data to support building energy design in a tropical climate," Sustainable Cities and Society, p. 106629, 2025/07/10/ 2025, doi: https://doi.org/10.1016/j.scs.2025.106629.
[45] P. Shen, J. Liu, and M. Wang, "Fast generation of microclimate weather data for building simulation under heat island using map capturing and clustering technique," Sustainable Cities and Society, vol. 71, 2021, doi: 10.1016/j.scs.2021.102954.
[46] P. Shen, Y. Ji, Y. Li, M. Wang, X. Cui, and H. Tong, "Combined impact of climate change and urban heat island on building energy use in three megacities in China," Energy and Buildings, vol. 331, 2025, doi: 10.1016/j.enbuild.2025.115386.
[47] R. Qi, L. Lu, and H. Yang, "Investigation on air-conditioning load profile and energy consumption of desiccant cooling system for commercial buildings in Hong Kong," Energy and Buildings, vol. 49, pp. 509-518, 2012, doi: 10.1016/j.enbuild.2012.02.051.
[48] C. T. Cheung, K. W. Mui, and L. T. Wong, "A hybrid simulation approach to predict cooling energy demand for public housing in Hong Kong," Building Simulation, vol. 8, no. 6, pp. 603-611, 2015, doi: 10.1007/s12273-015-0233-8.
[49] J. Wang, B. J. Kudagama, U. S. Perera, S. Li, and X. Zhang, "Framework for generating high-resolution Hong Kong local climate projections to support building energy simulations," Physics of Fluids, vol. 37, no. 3, 2025, doi: 10.1063/5.0254669.
[50] L. Bourikas et al., "Transforming typical hourly simulation weather data files to represent urban locations by using a 3D urban unit representation with micro-climate simulations," Future Cities and Environment, vol. 2, no. 0, 2016, doi: 10.1186/s40984- 016-0020-4.
[51] Y. Cui, D. Yan, T. Hong, C. Xiao, X. Luo, and Q. Zhang, "Comparison of typical year and multiyear building simulations using a 55-year actual weather data set from China," Applied Energy, vol. 195, pp. 890-904, 2017, doi: 10.1016/j.apenergy.2017.03.113.
[52] B. Qian, T. Yu, C. Zhang, P. Heiselberg, B. Lei, and L. Yang, "A method of determining typical meteorological year for evaluating overheating performance of passive buildings," Building Simulation, vol. 16, no. 4, pp. 511-526, 2023, doi: 10.1007/s12273- 022-0967-z.
[53] O. M. Zaki, R. H. Mohammed, and O. Abdelaziz, "Separate sensible and latent cooling technologies: A comprehensive review," Energy Conversion and Management, vol. 256, 2022, doi: 10.1016/j.enconman.2022.115380.
[54] X. Yang, L. Yao, and L. L. H. Peng, "Impacts of urban air temperature and humidity on building cooling and heating energy demand in 15 cities of eastern China," Energy, vol.
288, 2024, doi: 10.1016/j.energy.2023.129887.
[55] D. Maia-Silva, R. Kumar, and R. Nateghi, "The critical role of humidity in modeling summer electricity demand across the United States," Nat Commun, vol. 11, no. 1, p. 1686, Apr 3 2020, doi: 10.1038/s41467-020-15393-8.
[56] J. Cao, M. Li, R. Zhang, M. Wang, and Y. Li, "An efficient meteorological index for estimating building latent cooling load based on coupled temperature and humidity," Journal of Building Engineering, vol. 101, 2025, doi: 10.1016/j.jobe.2025.111933.
[57] F. Kheiri, J. S. Haberl, and J.-C. Baltazar, "Impact of outdoor humidity conditions on building energy performance and environmental footprint in the degree days-based climate classification," Energy, vol. 283, 2023, doi: 10.1016/j.energy.2023.128447.
[58] J. Cao, M. Li, X. Yang, R. Zhang, and M. Wang, "The impact of urban dry island on building energy consumption is overlooked compared to urban heat island in cold climate," Energy and Buildings, vol. 320, 2024, doi: 10.1016/j.enbuild.2024.114655.
[59] Hong Kong Housing Authority. "Estate Locator." https://www.housingauthority.gov.hk/en/global-elements/estate-locator/index.html (accessed Sept. 22nd,, 2025).
[60] Hong Kong Housing Authority, "Standard Block Typical Floor Plans," 2020, doi: https://www.housingauthority.gov.hk/en/global-elements/estate-locator/standardblock-typical-floor-plans/.
[61] W. Wang, W. Zhou, E. Y. Y. Ng, and Y. Xu, "Urban heat islands in Hong Kong: statistical modeling and trend detection," Natural Hazards, vol. 83, no. 2, pp. 885-907, 2016, doi: 10.1007/s11069-016-2353-6.
[62] L. W. Siu and M. A. Hart, "Quantifying urban heat island intensity in Hong Kong SAR, China," Environ Monit Assess, vol. 185, no. 5, pp. 4383-98, May 2013, doi: 10.1007/s10661-012-2876-6.
[63] Hong Kong Observatory, "Information of Weather Station," 2025. [Online]. Available: https://www.hko.gov.hk/en/cis/stn.htm.
[64] Y. Wang and Z. Gou, "Evaluating urban heat mitigation strategies: Microclimate effects and energy consumption in residential areas across diverse climates," Energy and Buildings, vol. 343, 2025, doi: 10.1016/j.enbuild.2025.115950.
[65] HKGBC and BEAM Society Limited, BEAM plus new buildings version 1.2. 2012.
[66] M. Bojic, F. Yik, K. Wan, and J. Burnett, "Influence of envelope and partition characteristics on the space cooling of high-rise residential buildings in Hong Kong," Building and Environment, vol. 37, no. 4, pp. 347-355, 2002, doi: 10.1016/s0360- 1323(01)00045-2.
[67] K. Wang, M. Gong, and B. Zhao, "Moth-eye photonic cooler for efficient daytime radiative cooling," Applied Thermal Engineering, vol. 290, 2026, doi: 10.1016/j.applthermaleng.2026.130004.
[68] Z. Lin and S. Deng, "A study on the characteristics of nighttime bedroom cooling load in tropics and subtropics," Building and Environment, vol. 39, no. 9, pp. 1101-1114, 2004, doi: 10.1016/j.buildenv.2004.01.035.
[69] Y. T. Kwok, R. Schoetter, and E. Ng, "Towards decarbonisation targets by changing
setpoint temperature to avoid building overcooling and implementing district cooling in (sub)tropical high-density cities - A case study of Hong Kong," Sci Total Environ, vol. 811, p. 152338, Mar 10 2022, doi: 10.1016/j.scitotenv.2021.152338.
[70] "ERA5 hourly data on single levels from 1940 to present." https://cds.climate.copernicus.eu/datasets/reanalysis-era5-single-levels?tab=overview (accessed May. 26th, 2025).
[71] Hong Kong Observatory, "Beware of Health Effects of Extremely Hot Weather," 2023. [Online]. Available: https://www.hko.gov.hk/en/education/weather/hot-and-coldweather/00706-Beware-of-Health-Effects-of-Extremely-Hot-Weather.html.
[72] X. Yang, Y. Chen, L. L. H. Peng, and Q. Wang, "Quantitative methods for identifying meteorological conditions conducive to the development of urban heat islands," Building and Environment, vol. 178, 2020, doi: 10.1016/j.buildenv.2020.106953.
[73] T. Kuczyński, M. Gortych, A. Staszczuk, and A. Bocheńska-Skałecka, "Timedependent performance of residential buildings under climate change: Thermal resilience, seasonal asymmetry and life-cycle carbon design consequences," Energy, vol. 347, 2026, doi: 10.1016/j.energy.2026.140448.
[74] Y. Zhao et al., "Prioritizing Nature-Based Solutions and Technological Innovations to Accelerate Urban Heat Mitigation Pathways," Annual Review of Environment and Resources, vol. 50, no. 1, pp. 357-379, 2025, doi: 10.1146/annurev-environ-111523- 102159.
[75] C. Feng, Y. Lei, X. Huang, W. Zhang, Y. Feng, and X. Zheng, "Experimental and theoretical analysis of sub-ambient cooling with longwave radiative coating," Renewable Energy, vol. 193, pp. 634-644, 2022, doi: 10.1016/j.renene.2022.05.037.
[76] H. Zhong, P. Zhang, Y. Li, X. Yang, Y. Zhao, and Z. Wang, "Highly Solar-Reflective Structures for Daytime Radiative Cooling under High Humidity," ACS Appl Mater Interfaces, vol. 12, no. 46, pp. 51409-51417, Nov 18 2020, doi: 10.1021/acsami.0c14075.
[77] Y. Liu et al., "Optimization of top-floor rooms coupling cool roofs, natural ventilation and solar shading for residential buildings in hot-summer and warm-winter zones," Journal of Building Engineering, vol. 66, p. 105933, 2023/05/01/ 2023, doi: https://doi.org/10.1016/j.jobe.2023.105933.
[78] P. Karachaliou, M. Santamouris, and H. Pangalou, "Experimental and numerical analysis of the energy performance of a large scale intensive green roof system installed on an office building in Athens," Energy and Buildings, vol. 114, pp. 256-264, 2016/02/15/ 2016, doi: https://doi.org/10.1016/j.enbuild.2015.04.055.
[79] S. A. Rashid et al., "Retrofitting low-cost heating ventilation and air-conditioning systems for energy management in buildings," Applied Energy, vol. 236, pp. 648-661, 2019/02/15/ 2019, doi: https://doi.org/10.1016/j.apenergy.2018.12.020.
[80] N. V. S. K. Manapragada and J. Natanian, "Urban Microclimate and Energy Modeling: A Review of Integration Approaches," Sustainability, vol. 17, no. 7, p. 3025, 2025. [Online]. Available: https://www.mdpi.com/2071-1050/17/7/3025.
[81] K. Javanroodi, M. Mahdavinejad, and V. M. Nik, "Impacts of urban morphology on
reducing cooling load and increasing ventilation potential in hot-arid climate," Applied Energy, vol. 231, pp. 714-746, 2018/12/01/ 2018, doi: https://doi.org/10.1016/j.apenergy.2018.09.116.
[82] B. Gucyeter, "Evaluating diverse patterns of occupant behavior regarding control-based activities in energy performance simulation," Frontiers of Architectural Research, vol. 7, no. 2, pp. 167-179, 2018/06/01/ 2018, doi: https://doi.org/10.1016/j.foar.2018.03.002.
[83] Y. Han et al., "Enhancing building energy efficiency with thermal mass optimization," Advances in Applied Energy, vol. 18, 2025, doi: 10.1016/j.adapen.2025.100224.
[84] D. Yan et al., "Occupant behavior modeling for building performance simulation: Current state and future challenges," Energy and Buildings, vol. 107, pp. 264-278, 2015/11/15/ 2015, doi: https://doi.org/10.1016/j.enbuild.2015.08.032.
[85] G. Happle, J. A. Fonseca, and A. Schlueter, "Impacts of diversity in commercial building occupancy profiles on district energy demand and supply," Applied Energy, vol. 277, p. 115594, 2020/11/01/ 2020, doi: https://doi.org/10.1016/j.apenergy.2020.115594.
Highlights:
Extreme heatwaves intensify Urban Heat and Moisture Island effects in Hong Kong.
⚫ Nighttime urban cooling load is up to 17.4% higher than in rural areas in heatwaves.
• Urban cooling load in remaining hours is up to 7.4% lower than in rural areas.
⚫ Latent cooling load results show complex, site-dependent humidity responses.
⚫ Occupancy schedules can amplify the impact of urban–rural climate differences.
Declaration of Interest Statement
☒ The authors declare that they have no known competing financial interests or personal relationships that could have appeared to influence the work reported in this paper.
☐ The author is an Editorial Board Member/Editor-in-Chief/Associatef Editor/Guest Editor for this journal and was not involved in the editorial review oro the decision to publish this article.
☐ The authors declare the following financial interests/personal relationshipswhich may be considered as potential competing interests:e
Fig. 1. Research Framework
Publication Details
Journal
Energy
Publication Year
2026
Authors
Guanli Feng, Pengyuan Shen, Shupeng Zhou, Shaochen Wang, Xing Zheng
Categories
Urban climate and building adaptation strategies