
Integrating renewable energy with electric vehicle charging infrastructure in China: A strategy for enhanced accessibility and carbon abatement
Yuyu Zheng, Aoye Song, Zhaohui Dan, Xin Sun, Shuncheng Lee, Wei Feng, Pengyuan Shen, Yuekuan Zhou
2026
Nexus
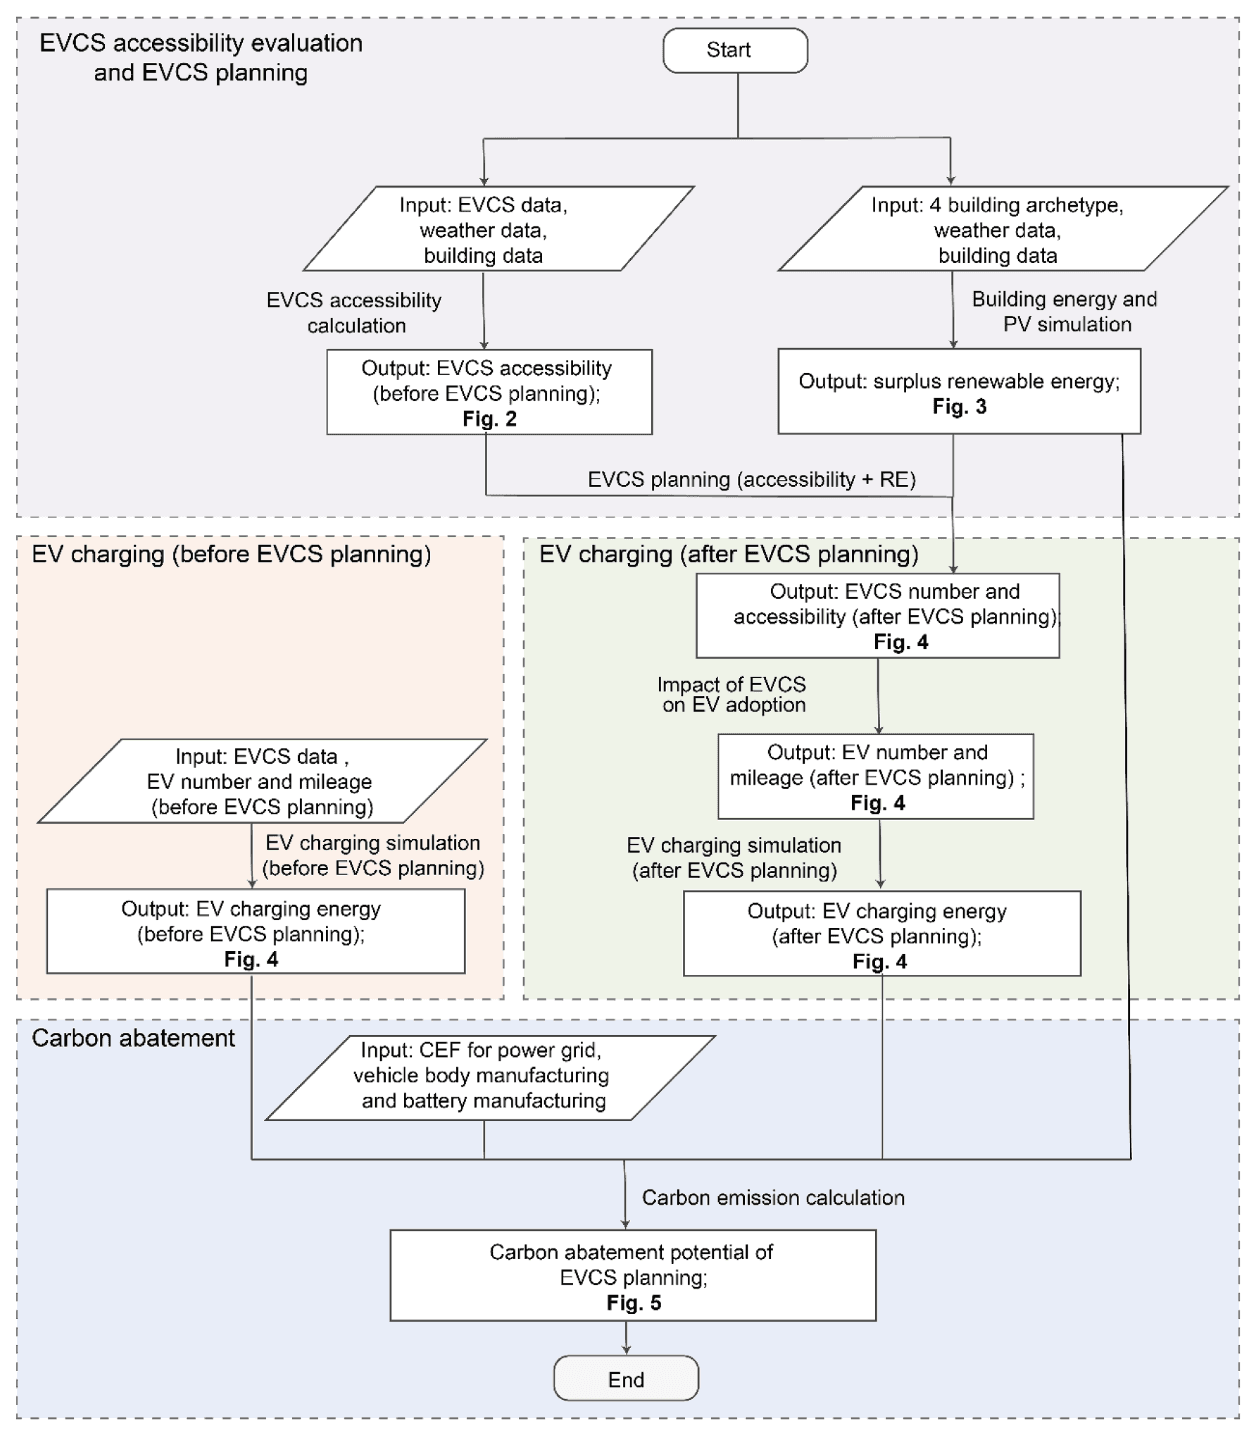
Figure. 1. Overall process flowchart
Summary
This study develops a climate-sensitive framework to assess electric vehicle charging station (EVCS) accessibility across 31 Chinese provincial capitals. It proposes an optimized EVCS deployment strategy matching local surplus building photovoltaic power, which narrows accessibility gaps and lowers the Gini coefficient to 0.3. Multi-scenario simulations quantify city-wide carbon abatement potential from coordinated building renewable energy and EV charging, providing differentiated policy guidance for equitable low-carbon transport infrastructure planning.
Abstract
E-mobility accelerates carbon neutrality, with electric vehicle charging stations (EVCSs) crucial for reducing range anxiety and supporting adoption. Yet, limited research on EVCS accessibility and renewable energy equity under diverse climates constrains carbon abatement potential. This study proposes an integrative framework that connects two climate-sensitive dimensions: EVCS accessibility, affected by driving range under varying conditions, and renewable energy distribution, shaped by climate variability. Using data from 31 provincial capitals in China, we evaluate disparities in accessibility and equity and introduce an innovative EVCS planning strategy. Results show accessibility can rise from 0.7 to 47.3 to 1.7–49.5 kW/10,000 m2, while the Gini coefficient falls to 0.3, indicating enhanced equity. The strategy enables annual carbon mitigation of 1.4 × 10⁶–8.3 × 10⁸ kg in the near term. Policy implications include targeted subsidies, optimized deployment in underserved areas, and integration of EVCS with renewable energy systems to enhance accessibility, equity, and emission reduction.
INTRODUCTION
The global transition to carbon neutrality hinges on the rapid electrification of transport, yet the success of this shift is constrained by two critical challenges: ensuring equitable access to electric vehicle charging stations (EVCSs)1 and powering them with clean, renewable energy (RE).2 Insufficient or inequitably distributed charging infrastructure can create “charging deserts,” leading to range anxiety3 and hindering electric vehicle (EV) adoption.4 Simultaneously, relying on carbonintensive grids for charging negates the environmental benefits of e-mobility, particularly in regions with high grid emission factors.5 These challenges are acutely magnified in China, where vast climatic, urban, and energy landscapes require a highly integrated planning approach.6 Consequently, a framework that co-optimizes both climate-sensitive accessibility and RE integration is essential to unlock the full decarbonization potential of electric transport.
The electrification of energy systems fundamentally reshapes demand-side dynamics, with transportation electrification creating massive, spatially concentrated new loads on the power grid.7 A primary challenge for urban planners is to manage the deployment of the requisite infrastructure, namely EVCSs, in a manner that is both efficient and socially equitable. A significant body of research has addressed this from a socio-spatial perspective, focusing on accessibility and planning.8 These studies often leverage urban data to model charging demand,9 optimize station locations,10 and assess economic co-benefits, such as property values,11 business activity,12 and local economic development.13 Crucially, a growing sub-field addresses “energy justice” within this transition,14 using metrics like the Gini coefficient15 to quantify and mitigate disparities in EVCS access across different socio-economic groups and communities.16 This research is vital for preventing the emergence of “charging deserts” and ensuring an inclusive energy transition.17 However, while excelling at socio-economic analysis, this research stream suffers from a critical engineering blind spot: it largely overlooks how climate-dependent variations in EV driving range dynamically alter the true service radius of charging stations. Consequently, most large-scale accessibility studies fail to account for climatic diversity.
A core tenet of energy systems electrification is the “sector coupling” of transport and power,18 where EVs are envisioned not just as loads but as active grid participants.19 The literature on this topic is vast, primarily focusing on micro-level energy management and control.20 This includes sophisticated algorithms for smart charging,21 demand respons e,22 and bidirectional power flow via vehicle-to-grid (V2G), 23 building-to-vehicle (B2V) technologies,24 or coordinated charging strategies.25 These studies convincingly demonstrate how intelligent control can transform millions of EVs into a virtual power plant for grid balancing26 and absorbing intermittent renewables.27 However, this research is overwhelmingly temporally focused and spatially abstracted. While adept at solving the temporal challenge of “when” to charge, it largely ignores the geographical challenge of “where” charging infrastructure must be located to enable these interactions at scale. Consequently, a disconnect persists between spatially blind energy optimization algorithms and the practical realities of urban infrastructure planning.
The ultimate metric for the success of energy system electrification is its quantifiable contribution to decarbonization. The literature addresses this from several perspectives. A foundational stream uses life cycle assessment (LCA)28 to rigorously compare the carbon footprints of EVs and internal combustion engine vehicles (ICEVs)29 during vehicle manufacturing,30 energy use during operation,31 and in some cases, end-of-life processes,32 establishing that an EV’s environmental benefit is critically contingent on the cleanliness of its electricity source.33 Building on this, energy system models explore macro-scale decarbonization pathways,7 assessing the impact of broad policy levers like RE targets34 or carbon pricing35 on overall grid emissions. A third, more granular area focuses on the synergistic operation of coupled sectors,36 particularly the buildingtransport nexus,37 by modeling how integrated systems can enhance local RE use and resilience.38 However, these diverse research streams share a common limitation: they tend to operate at the extremes of the analytical scale. Research is often either hyperspecific, focusing on the technical potential of a single technology or vehicle, or highly aggregated, analyzing macro-level energy systems without granular geospatial detail. Consequently, the critical role of data-driven, meso-scale EVCS infrastructure planning in bridging these scales and actively shaping decarbonization outcomes remains a significant analytical blind spot.
Based on the literature review, we identify three critical research gaps that prevent a holistic approach to EVCS planning within the broade context of energy system electrification.
(1) The lack of a climate-sensitive framework for accessibility assessment. Existing studies often overlook the quantifiable impact of varying climate on EV driving ranges, a critical engineering factor that alters the true service coverage of EVCS. Consequently, robust cross-city comparisons of accessibility and equity remain limited.
(2) The absence of an integrated planning strategy bridging social needs and energy system constraints. There is a lack of integrated planning strategies that comprehensively co-optimize for both social equity (addressing accessibility gaps) and engineering feasibility (aligning with the spatial distribution of surplus RE). Furthermore, the consequential impact of such strategies on stimulating EV adoption has not been clearly quantified.
(3) The unquantified system-wide decarbonization impact of spatially aware EVCS deployment. Previous research has not adequately studied how the strategic, meso-scale spatial deployment of EVCS infrastructure actively reshapes urban energy flows. Consequently, the aggregated, city-wide carbon abatement potential that emerges directly from an optimized planning strategy remains critically under-explored, particularly across multiple cities and diverse energy transition scenarios.
To address these gaps, this study proposes an integrative framework that connects two climate-sensitive dimensions: EVCS accessibility, which is influenced by EV driving range under different climate conditions, and the spatial distribution of surplus RE, which is affected by climate-dependent building energy demand and climate-dependent renewable generation potential. By linking these two aspects, the framework enables a unified evaluation of EVCS deployment strategie and their carbon abatement potential across diverse climate zones Specifically, this research makes three major contributions
(1) To assess the disparities in EVCS distribution, an EVCS acces sibility evaluation framework focusing on the spatial distribu tion of charging supply and demand has been developed comprehensively considering climate impacts on EV driving range across 31 provincial capital cities in China. This frame work is used to evaluate the level of EVCS infrastructure across these cities with real-world data, providing a foundation for sub sequent planning and optimization.
(2) Building on the accessibility evaluation and the spatial distribu tion of surplus RE, an innovative EVCS planning strategy has been proposed and used to enhance EVCS accessibility and RE penetration across the 31 provincial capital cities, thereb increasing EV adoption (including the number of EVs and annual EV mileage), and amplifying carbon abatement po tential.
(3) Focusing on the coordination of RE flows, the study examines the role of EVCS in the electrified energy network. Through the strategic deployment of EVCS and power flow dispatch, car bon abatement potentials across 31 provincial capital cities in China have been predicted and estimated, considering different levels in net-zero energy transitions and varying climatic condi tions in five climate zones in China.
Building on the previously outlined innovations, this study develops an optimized EVCS deployment strategy across 31 provincial capitals. The strategy is informed by two critical, climate-sensitive factors: the spatial distribution of EVCS accessibility and the availability of surplus RE. Therefore, the study provides a novel, interdisciplinary framework that combines engineering and social science perspectives to offer actionable insights for EVCS planning, energy transition, and carbon mitigation strategies in urban contexts, which provides actionable in sights for urban planners, policymakers, and EVCS operators to guide effective energy transition and carbon abatement strategies.
RESULTS
This study aims to enhance EVCS infrastructure in areas with low accessibility yet high RE potential, in order to boost EV adoption and maximize carbon abatement. Our analytical framework (Figure 1) proceeds in three stages, detailed in the subsequent sections: (1) EVCS accessibility assessment for 31 cities across different climatic zones (Figure 2), (2) EVCS expansion planning based on accessibilit distribution gaps and RE distribution (Figures 3 and 4), and (3) Carbon abatement potential of optimized EVCS deployment acros China’s climate zones (Figure 5).
EVCS accessibility assessment for 31 cities across different climatic zones
To assess the adequacy of charging infrastructure, this study proposes a climate-sensitive EVCS accessibility metric. This approach is critical as temperature variations across climates impact EV battery performance and driver behavior, thus altering the effective service range of an EVCS.39 Accessibility is defined as the ratio of available charging supply to potential charging demand within discrete urban community cells (Figure 2A). Specifically, it is calculated as the total charging power of accessible EVCSs (supply) divided by the total build ing area (demand proxy) within each grid community, with details pro vided in the methods section: sample selection and accessibilit metrics for EVCS accessibility analysis.
A key feature of our methodology is the use of building area as a proxy for potential charging demand. This is justified because buildings are the primary destinations of most EV trips and serve as a robust indica tor of human activity density. Furthermore, Chinese urban planning standards link building area directly to parking provisions, reinforcing its validity as a proxy for potential vehicle and charging demand.40 A detailed rationale for this approach is provided in Note S1.38 This framework considers current EV ownership as a dependent variable spurred by infrastructure improvements, rather than a direct input for accessibility calculation, aligning with the study’s goal of stimulating EV adoption.

Figure 1. Overall process flowchart
The main process is to enhance the EVCS infrastructure in communities with poor EVCS accessibility and sufficient surplus renewable energy. This is expected t increase EV adoption and improve renewable energy penetration, ultimately increasing the carbon abatement potential of electric vehicles (EVs).
Applying this method to Guangzhou (Figure 2B) reveals distinct spatia patterns. It can be observed that in areas with high building density, such as the city center, the EVCS accessibility distribution aligns closely with the distribution of total EVCS charging station power. In contrast, some grid communities in suburban areas have higher EVCS accessibility due to lower charging demands. Beyond Guangzhou, our analysis of representative cities across other climate zones—from cold Beijing to temperate Kunming—reveals a consistent spatial pattern (Figure 2C). EVCS accessibility is typically highest in urban cores but remains unevenly distributed, with significant portions of cities like Shenyang (39% of communities) having no EVCS coverage at all. (The complete EVCS power and accessibility distributions for all 31 provincial capital cities are provided in Figures S1 and S2).
To quantify these city-wide characteristics, we assessed all 31 provincial capitals using two key metrics. The average EVCS accessibility evaluates the overall sufficiency of charging infrastructure across the city. And the Gini coefficient, which is a well-established measure of inequality,41 evaluates the spatial disparity in accessibility within each city (see the methods section: sample selection and accessibility metrics for EVCS accessibility analysis for details). The results, summarized in Figure 2D, highlight significant disparities. Haikou demonstrates the best performance with the highest average accessibility (47.3 kW/10,000 m2) and the most equitable distribution (Gini = 0.35). A clear trend emerges where cities in colder northern climates (e.g., Harbin, Urumqi) exhibit the lowest accessibility levels. Across all 31 cities, the median accessibility is a modest 11.8 kW/10,000 m2, with a high median Gini coefficient of 0.62, indicating that inequitable access to public charging is a widespread issue in urban China (see Table S1 for detailed data). The robustness of our accessibility metric was validated through sensitivity analyses of grid community sizes and outlier handling, which confirmed the stability of our findings (see Tables S2–S4 for details).
DEVCS accessibility results of the 31 provincial capital cities Mean (kW/10000m²
A Illustration of EVCS accessibility calculation

cEVCS accessibility distribution of typical provincial capital cities (kW/10000m²)
BGuangzhou EVCS accessibility distribution


Figure 2. Methodology and results of EVCS accessibility evaluation
(A) Illustration of EVCS accessibility calculation.
(B) EVCS accessibility distribution in Guangzhou.
(C) EVCS accessibility distribution of typical provincial capital cities.
(D) Average EVCS accessibility results and disparities in EVCS accessibility (Gini coefficient) of the 31 provincial capital cities.


B Total BIPV and rooftop C Total building electricity D Total energy shortage before E Total energy shortage after


Building energy simulation results of Guangzhou

F Building energy simulation before adding PV farm (from 3.19 to 3.21, near Spring Equinox)
G
Building energy simulation after adding PV farm (from 3.19 to 3.21, near Spring quinox


H Building energy simulation results of the 31 provincial capital cities
Figure 3. Overview of the integrative energy system and building energy simulation results in Guangzhou (A) Illustration of integrative energy systems.
(B) Annual total BIPV and rooftop PV generation.
(C) Annual total building energy consumption.
(D) Annual total energy shortage before adding PV farms.
(E) Annual total energy shortage after adding PV farms
This analysis centers on climate-modulated EVCS accessibility. While it identifies spatial gaps for initial planning, maximizing carbon mitigation also requires considering the distribution of surplus RE. Therefore, the following section integrates these accessibility gaps with surplus RE distribution to inform a comprehensive deployment strategy.
(Note: EVCS accessibility refers to how much EV charging power is available from EVCS per building area of building users. The Gini coefficient refers to the level of inequality in the distribution of EVCS accessibility among different communities within a city, with higher values indicating greater disparities. Gray areas represent non-urban regions outside the scope of this study (e.g., Figure 2B). The specific method for delineating these regions is detailed in the methods section: sample selection and accessibility metrics for EVCS accessibility analysis).
EVCS expansion planning based on accessibility distribution gaps and renewable energy distribution
EVCS can work as an intermediary bridge to associate buildings, the e-mobility EVs, and the power grid.42 To align EVCS deployment with clean energy availability, we simulated the surplus RE within urban communities. Our model (Figure 3A) integrates building-integrated photovoltaics (BIPV) and rooftop PV with four types of urban buildings to estimate local RE generation and consumption. To achieve a net-zero energy balance for buildings, the model also incorporates supplemental PV farms in suburban areas to offset energy deficits.43 The detailed energy modeling, including building profiles, the feasibility of PV farms, and the rationale for focusing on solar PV, is provided in the methods section: surplus renewable energy simulation for buildings and communities, Notes S2 and S3,44 and Table S5.
Our simulations in Guangzhou reveal the city’s energy landscape. While areas with high building density generate substantial RE (Figure 3B) and exhibit high energy consumption (Figure 3C), local PV generation is insufficient to meet demand, resulting in significant annual energy shortages across most communities (Figure 3D). However, by incorporating PV farms, an annual net-zero energy balance can be achieved city-wide (Figure 3E). Beyond the annual balance, hourly dynamic simulations highlight a crucial temporal mismatch. Even after achieving net-zero on an annual basis with PV farms, significant hourly surpluses of RE are still generated, particularly during midday solar peaks (compare Figures 3F and 3G). This surplus RE, which exists even when building demand is met, provides a critical opportunity for clean EV charging.
Expanding this analysis to all 31 provincial capitals (Figure 3H), we observe diverse energy profiles. Cities like Shanghai exhibit the largest energy deficits, requiring extensive PV farm capacity. Conversely, cities such as Kunming and Lhasa can achieve a netzero building energy transition primarily through BIPV and rooftop PV. These results map the spatial and temporal availability of surplus RE across China, forming the second critical input alongside accessibility gaps for our subsequent EVCS expansion planning. (Detailed city-level data are available in Figures S3–S6; Table S1).
Our EVCS expansion strategy integrates accessibility gaps with sur plus RE availability to guide new infrastructure deployment (Figure 4A). The core principle is to prioritize new EVCSs in commu nities with the lowest accessibility, while constraining the new capac ity by the local surplus RE supply. The primary planning objective is to enhance charging equity, aiming to reduce each city’s EVCS accessi bility Gini coefficient to below 0.3, a threshold representing a state of relative equality.45,46 (The detailed methodology and rationale for focusing on the Gini coefficient are described in the method section: EVCS planning method considering both accessibility gaps and surplus renewable energy distribution and Note S4).
Applying this strategy to Guangzhou (Figure 4B), new charging piles are strategically placed in underserved areas. This significantl improves both the overall level and the fairness of EVCS provision, as shown by the city-wide accessibility maps before and after planning (Figures 4C and 4D). The average accessibility increases from 36.2 to 44.9 kW/10,000 m2, while the Gini coefficient drops from a highly unequal 0.52 to the target of 0.30.
These infrastructure improvements are projected to stimulate signifi cant growth in EV adoption. As illustrated in Figure 4E, our empirica analysis confirms a strong positive relationship: enhanced EVCS infrastructure leads to both a higher number of EVs and increased annual mileage per vehicle. Specifically, the model indicates that the addition of one public charging pile is associated with an increase of approximately 2.4 EVs. As a result of this increased adoption and mileage, the total annual EV charging energy in Guangzhou also rises substantially, a trend visible in the spatial distribution maps before and after planning (Figures 4F and 4G). (The detailed regression models, including robustness checks, are provided in the methods section: relationship between EVCS and EV adoption and Tables S6–S8).
The nationwide impact of this planning strategy is summarized in Figures 4H–4K. Across all 31 cities, the plan leads to significant improvements in four key areas: EVCS accessibility (H), EV ownership (I), annual mileage (J), and total charging energy demand (K). Notably, the strategy successfully enhances both the level and equity of charging access; city-level average accessibility is lifted from a range of 0.7–47.3 kW/10,000 m2 to 1.7–49.5 kW/10,000 m2, while the Gini coefficient in each city is reduced to the target of 0.3 (Figure 4H). This tailored approach is exemplified by the varied scale of intervention: Shanghai requires new piles to achieve this goal, whereas Haikou requires only 200. The resulting growth in EV adoption and usage significantly boosts the overall electricit demand for charging. By directing this new demand to communities with identified RE surpluses, the strategy creates a critica opportunity to enhance renewable energy penetration and maximize carbon abatement potential, which will be quantified in the following section. (City-specific planning results are available in Figures S7– S10; Table S9).
(Note: EVCS accessibility refers to how much EV charging power i available from EVCS per building area of building users; the Gini coef ficient refers to the level of inequality in the distribution of EVCS acces sibility among different communities within a city, with higher value indicating greater disparities).
Carbon abatement potential of optimized EVCS deployment across China’s climate zones
This section quantifies the carbon abatement potential unlocked by our integrated EVCS planning and RE deployment strategy. We first analyzed how increasing levels of distributed RE affect the cleanliness of EV charging. We considered three configurations: no RE, adding BIPV/rooftop PV, and achieving a full net-zero building paradigm with PV farms. As shown in Figures 5A–5C, progressively adding RE dramatically reduces reliance on grid electricity for EV charging and increases the direct use of clean energy via B2V. This directl
D EVCS accessibility after planning (kW/10000m²)


(A) EVCS planning method flowchart
Figure 4. Impact of EVCS planning on EVCS accessibility, total EV number, and total annual charging energ translates to lower life cycle carbon emissions per kilometer for EVs, significantly widening their advantage over traditional ICEVs across all cities (Figure 5D). (See methods section: annualized carbon emissions from EV and ICEV manufacturing and operation).
(B) Planning of new EVCS piles for Guangzhou.
(C) EVCS accessibility distribution in Guangzhou before adopting the EVCS planning method.
(D) EVCS accessibility distribution in Guangzhou after adopting the EVCS planning method.
(E) Impact of EVCS planning method on EV adoption.
(F) EV charging energy distribution in Guangzhou before adopting the EVCS planning method
(G) EV charging energy distribution in Guangzhou after adopting the EVCS planning method.
Building on this, we evaluated the total urban-scale carbon abatement across four scenarios: a baseline (Scenario 1: before planning, no RE), planning only (Scenario 2: after planning, no RE), and two integrated scenarios (Scenario 3: planning + BIPV/rooftop PV; Scenario 4: planning + net-zero buildings). This comparative analysis is conducted within a short-term framework to isolate the direct impact of our proposed interventions, assuming other long-term drivers remain constant (see Note S5 for rationale). The baseline carbon emissions are substantial, particularly in large cities like Shanghai (Figure 5E).
Our results demonstrate that simply optimizing EVCS placement (Scenario 2) yields only modest carbon reductions, as the benefits are constrained by the grid’s carbon intensity (Figure 5F). The true potential is unlocked when EVCS planning is coupled with RE deployment. In Scenario 3, the availability of surplus RE significantly boosts carbon abatement, with cities like Guangzhou showing a total mitigation of kg (Figure 5G). The maximum potential is realized in Scenario 4, where the annual carbon abatement spans a wide range. It reaches as high as kg in Guangzhou, while a city like Lhasa shows the lowest mitigation at kg (Figure 5H). A clear pattern emerges: the most significant carbon reductions occur in cities that combine aggressive EVCS expansion with abundant local RE, whereas cities in colder regions with carbon-intensive grids show more limited gains.
Finally, we assessed the economic feasibility of this strategy under Scenario 4 by analyzing the required EVCS investment and the resulting levelized carbon cost (LCC), which represents the cost per kilogram of abated. While cities with the highest abatement potential like Shanghai require the largest investment RMB), they do not necessarily have the lowest LCC (Figure 5I). The LCC varies significantly, ranging from a highly efficient 0.05 RMB/kg in Haikou to over 1.3 RMB/kg in northern cities, reflecting regional differences in climate, grid carbon intensity, and RE availability (Figure 5J). These findings underscore that an integrated planning approach is crucial for achieving cost-effective decarbonization in the transport sector. (Detailed city-level data related to carbon emission abatement are available in Tables S10–S12).
DISCUSSION
In the global transition to carbon neutrality, EVCSs are critical nodes for integrating e-mobility with RE and building electrification, and this study pioneers an integrated planning framework to maximize their synergistic potential. Specifically, we first develop a climate-sensitive framework to evaluate EVCS accessibility across 31 Chinese cities, then propose an innovative planning strategy targeting accessibility gaps while leveraging local RE surpluses, and finally quantify the resulting carbon abatement potential under various net-zero energy scenarios. The findings provide a scientific basis for guiding government policy and commercial strategy in the e-mobility sector. The key conclusions of this study are as follows.
(1) Significant disparities in climate-adjusted EVCS accessibility exist across Chinese cities. Our quantitative assessment reveals that average accessibility ranges from 0.7 to 47.3 kW/ 10,000 m2, with Gini coefficients from 0.35 to 0.89, highlighting widespread inequity in charging infrastructure. This underscores the urgent need for targeted, data-driven planning.
(2) An integrated planning strategy effectively improves both accessibility and equity. By prioritizing underserved communities and constraining new capacity by local RE surplus, our strategy elevates average accessibility by a range of 1.0–
13.8 kW/10,000 and reduces the Gini coefficient to a more equitable 0.3 across all cities. This infrastructure enhancement is projected to increase EV ownership by vehicles and annual mileage by 488–8,219 km per city.
(3) Coupling EVCS planning with distributed RE is essential to maximize carbon abatement. While improved infrastructure alone provides modest benefits kg annua abatement), integrating it with building-level PV systems (Sce nario 3) and net-zero energy paradigms (Scenario 4) unlock the full potential, boosting the annual carbon mitigation to a range of kg. This demonstrates that stra tegic EVCS deployment serves as a crucial bridge for chan neling surplus RE into the transport sector.
These findings lead to several policy recommendations. First, policy makers should implement differentiated, needs-based subsidies to address inter-city accessibility disparities, supporting less developed regions. Second, urban planners should adopt a spatially targeted, intra-city optimization strategy, focusing on high-demand areas to improve equity and cost-effectiveness. Third, integrated incentive structures are needed to co-promote EVCS and distributed RE projects, such as building-integrated PV, to form unified net-zero energy systems.
While this study provides a robust framework, we acknowledge several limitations that open avenues for future research. Future work should aim to do the following: (1) refine charging demand models by incorporating spatiotemporal data for different building types, moving beyond the building area proxy; (2) deepen the empir ical analysis of how local socio-economic factors influence the EVCS-EV adoption relationship; (3) conduct detailed feasibilit studies on urban RE integration to validate the surplus energy assumptions; and (4) develop dynamic, long-term models that account for technological evolution and socio-economic shifts, extending beyond our short-term, static analysis.
METHODS
Sample selection and accessibility metrics for EVCS accessibility analysis
This section outlines the methodology used to calculate the accessi bility of EVCS across different cities in China, with a focus on identi fying areas with limited charging infrastructure.
This study selected 31 provincial capital cities as its research sample to ensure broad representation of China’s diverse economic land scapes and climatic conditions while maintaining methodological consistency (see Note S6 for a detailed rationale on sample selection and study area delineation)
EVCS data for each of the 31 cities were compiled from publicly avail able map-based mobile applications (e.g., Baidu Maps, Huolala).47–50 Key attributes, including geographic coordinates, number of piles, and power capacity for each station, were extracted through automated queries. To ensure data quality, we cross-validated a subset of locations with other digital map platforms and conducted physical site visits. The dataset was then filtered using administrative boundaries to assign each station to its respective city. As this study exclusively used publicly accessible infrastructure data, no personal or sensitive user information was involved. The final processed dataset is summarized in Table S13, and the origina data are available upon request to ensure replicability.
To calculate the accessibility of EVCS, each sample city was divided into square grids with a side length of (Figure 1A). Each grid represents a community, and the accessibility of each community was calculated using Equation 1, an indicator based on the suppl and demand of EVCS.


Figure 5. Comparison of renewable penetration of EV charging and carbon abatement potential from EVCS planning and renew able installation
(A) Energy of EV charging from the power grid under different RE configurations.
(B) Energy of EV charging from renewable systems under different renewable configurations.
(C) Renewable penetration ratio of EV charging under different renewable configurations.
(D) Life cycle carbon emission per kilometer for an EV under different renewable configurations.
where Accessibilityi, Charging Supplyi and Charging Demandi represent the accessibility, supply of EVCS and charging demand of community i in each provincial capital city.
The city’s overall EVCS accessibility level is described using the average accessibility (Equation 2) and the Gini coefficient (Equation 3) across all communities in the city.
Here, Average is the average EVCS accessibility for each provincial capital city, n is the number of community in that city, and Gini is the EVCS accessibility Gini coefficient for that city.
The supply of EVCS within a community i is represented by the total power of EVCS piles in the community i (Equation 4), which accounts for the substantial difference in practical use between slow chargers (e.g., 7-kW piles) and fast chargers (e.g., 60-kW piles). Compared to previous studies that used the number of EVCS or piles, using power provides a more accurate measure of EVCS supply.
where Charging Supplyi is the total charging supply in community denotes the number of charging piles in community i, and Power ofPilej is the power of the j-th charging pile in the community i.
The demand for EVCS is represented by the total building floor area within the community (Equation 5) (see Note S1 for more rationale). Building location, height, and floor area data were obtained from the dataset of Building height of Asia in 3D-GloBFP.51,52
Charging Demandi = Floor area of buildingj; (Equation 5)
where Charging Demandi is the total charging demand in community i, denotes the number of buildings in community i, and Floor area ofbuilding is the floor area of the j-th building in the community i. To simplify calculations and exclude the impact of auxiliary structures (e.g., restrooms, greenhouses, and guardhouses), all single-story buildings and buildings with rooftop areas less than 300 were excluded.
The service diameter d was adjusted by Consumption ratio according to the average EV driving range and energy consumption per range under different climates to calculate the size of a community (Equation 6).
where is the length of the grid community in each city, and d is the initial service diameter of EVCS. According to the Guidelines for Layout Planning of Electric Vehicle Charging Infrastructure,53 the service radius of an EVCS should be no less than 2 km, so the initial service diameter (2× service radius) is set to 5 km. Consumption is the ratio of the average energy consumption of an EV under the temperature conditions of a specific city to the optimal energy consumption of the EV(see the Note . The study area was restricted to the builtup regions of the (see Note S6 for more details).
The resulting accessibility values are then used as a foundation for subsequent EVCS planning.
Surplus renewable energy simulation for buildings and communities
To quantify the surplus RE within each community, we modeled each community as a microgrid capable of centrally managing and dis patching energy (Figure 3A). The simulation is based on four standardized building archetypes (residential, commercial, school, and office), each with a unique, climate-specific energy consumption and RE generation profile (from BIPV and rooftop PV). For each city these archetype profiles were generated at an hourly time step for an entire year (8,760 h) using detailed building energy simulations. (See Note ; Tables for more details.) Each building archetype in every city is simulated with an hourly time step, generating 8,760-h electricity consumption profile curves and production curves for BIPV and rooftop PV systems over a year.
The hourly profiles from the archetypes were then scaled up to the community level. For each community i, the total energy consumption and RE generation at each hour t were calculated by aggregating the contributions of all individual buildings within it (Equations 7 and 8) The energy profile of each individual building was scaled from its corresponding archetype based on its actual floor area (for consumption), facade area (for BIPV generation), and rooftop area (for rooftop generation), using data from the dataset Building height of Asia in 3D-GloBFP.51,52 Once the aggregated hourly energy consumption and RE production were determined, the net energ balance for each community was calculated. A positive balance indicates a surplus, while a negative balance signifies a shortage (Equations 9 and 10). This process yields an 8,760-h surplus/ shortage profile for each community under the baseline BIPV and rooftop PV scenario.
To model a city-wide net-zero energy building scenario, we calcu lated the supplemental PV farm area required to offset the city’s tota annual energy deficit. The energy generated by these farms was then allocated back to each community proportional to its shortage, creating an updated hourly surplus/shortage profile for this advanced scenario (Equation 11).
where the Total Shortag represents the total annual energy shortage across all communities in the city, PV Productio denotes the annual energy generation per unit area of PV under the city’s climatic condi tions, and Farm refers to the total PV farm area required for the city. The feasibility of installing these PV farms, based on available land area, is supported by our analysis detailed in Table S5.
The results from the surplus energy simulation in this section will b used to guide the EVCS expansion planning and simulate the EV charging process in the following section.
EV charging simulation and energy allocation method
To simulate the hourly EV charging energy demand for each commu nity, we developed a top-down aggregate model. Consistent with our accessibility framework, the spatial distribution of charging demand is assumed to be proportional to the building area within each commu nity (see Note S1 for rationale). This approach uses the national average temporal distribution of charging sessions57 to remain computationally feasible for a 31-city analysis, avoiding complex agent-based simulations. The simulation follows a four-step process:
Step 1 calculates total city-level demand: first, the total daily charging energy demand for each city was calculated by multiplying its average annual EV mileage (data from China Automotive Technology and Research Center with its climate-specific energy consumption per kilometer (see Note Figures S11 and S12). The annual mileage was averaged to a daily value. For Xining, however, the mileage data showed abnormally high values due to the influence of the New Energy Rally. To address this, the mileage data for Xining was replaced with vehicle travel data sourced from Yiche.60
Step 2 determines hourly charging sessions: using the average charging power of EVCSs in each city and the total daily EV energy consumption, the number of charging sessions per day is calculated (Equation 12, one charging session is assumed to last 1 h). Then, based on the distribution of charging times across 24 h (Ratiot, Annual Report on the Big Data of New Energy Vehicle in China, the number of EVs charging in each hour is determined (Equation 13).
Hourly Number of Charging y Number of Charging EV × Ratiot
(Equation 13)
Step 3 allocates demand to communities: since the study assumes that charging demand is proportional to building area, the number of charging EVs per hour is allocated to each community based on its building area ratio. If the number of charging EVs in a community exceeds the available charging stations during a given time, the excess EVs are allocated to the nearest community with available charging stations.
Step 4 derives final community energy profiles: finally, the hourly charging energy for each community was calculated by multiplying the number of allocated charging EVs by the community’s average charging pile power. The resulting annual total was cross-checked and scaled against the city-level total from Step 1 to ensure consistency.
EV charging from renewable energy (B2V) simulation
To determine the source of EV charging energy, the simulated hourly charging demand for each community (EV charging was compared against its available hourly surplus RE (Suprlus Energy ). The amount of energy drawn from local RE (B2V) is the minimum of these two values, with any remaining demand met by the power grid. An energy conversion efficiency of 0.9 was applied to the RE supplied to the charging stations.37
Here, Energy from is the energy that EVs charge from RE at time t in community i, Energy from the energy that EVs charge from po wer grid, EV charging is the total energy EVs charge, and Suprlus is the surplus energy at time t in community i.
Relationship between EVCS and EV adoption
To estimate the impact of infrastructure improvements, we developed two separate empirical regression models due to data availability constraints.
First, a two-way fixed-effects panel data model was used to quantify the relationship between the number of EVCS piles and EV ownership at the provincial level. It is assumed that the ratio between EV numbers and EVCS piles is consistent across provinces and cities.
where is the number of EV for province i in year t, EVCS Pi- is the number of EVCS piles for province i in year is the coefficient, Controls is the control variable-the number of vehicles, and ϵ is the error term.
Second, a cross-sectional model was developed to analyze the relationship between city-level EVCS accessibility and the average annual EV mileage. Due to the availability of only one year’s provincial EV mileage data, the annual average EV mileage of provincial capital cities is substituted with provincial data as the dependent variable
where EV Mileagei is the annual average EV mileage for city i, CityArea is the area of city i, EVCS Accessibilityi is the EVCS accessibility for city is the coefficient, Controls is the control variable, and ϵ is the error term. To account for the potential increase in EV mileage due to larger city sizes, mileage is adjusted and made dimensionless by dividing , the square root of the city area. Control variables include the city area and the energy ratio of city i, which represents the factor by which EV energy consumption per unit distance exceeds the standard consumption due to climate influences in that city.
Data on EV and vehicle numbers and brands from 2016 to the end of the first half of 2024 are sourced from the Website Dasouchezhiyun.6 EVCS pile counts are obtained from the China Electric Vehicle Charging Infrastructure Promotion Alliance.62 The average EVCS accessibility is derived from calculations in this study. EV mileage data comes from China Automotive Technology and Research Center City area refers to the built-up area of each city in the process of calculating metrics of EVCS accessibility. The energy ratio reflects the actual energy consumption multiple of EVs in each city (detailed in Note S7 and Figures S11 and S12). The mileage data for Xining was replaced with vehicle travel data sourced from Yiche.60 Details of regression results and robustness checks, including the use of additional control variables (GDP) and a lagged-variable approach to address potential endogeneity, are detailed in Tables S6–S8 and Note S8.
EVCS planning method considering both accessibility gaps and surplus renewable energy distribution
To enhance EVCS accessibility while leveraging local RE, we developed an iterative optimization algorithm that strategically adds new charging capacity. The algorithm is guided by the primary objective of reducing the city-wide Gini coefficient of accessibility to a target value of 0.3. The process, illustrated in Figure 4A, unfolds as follows:
Step 1 identifies the target community: in each iteration, the community i with the lowest current EVCS accessibility is identified as the candidate for new infrastructure.
Step 2 adds and constrains new stations: a standard charging station, assumed to consist of five 60-kW fast chargers, is notionally added to the target community. This addition is subject to a critical constraint: the new total charging power in the community must not exceed half of its average hourly surplus RE, ensuring that new demand aligns with local clean energy supply (Equation 18).
where Total charging power is the total power of charging piles for community i after planning, Hourly Surplus is the hourly surplus energy for community i when surplus energy is positive, and Hours is the number of hours when surplus energy is positive.
Step evaluates termination condition: after adding the new station, the city-wide Gini coefficient is recalculated. If the new Gini is less than or equal to 0.3, the algorithm terminates. Otherwise, it returns to Step 1 to identify the next target community.
Upon termination, the algorithm outputs the final number and spatial distribution of new EVCS piles. This output is then used to project the resulting increase in EV ownership and annual mileage (Equations 19 and 20), based on the coefficients from our empirical models:
Here, is the increase in the number of EVs in the city, ΔEVCS is the increase in the number of EVCS piles in the city, is the increase in the EV annual mileage in the city, and ΔEVCS Accessib is the increase in the average EVCS accessibility of the city. To avoid the interference of residuals ϵ in the regression model, the increase in the dependent variable (EV Numb is calculated by multiplying the changes in independent variables by their corre sponding coefficients , thereby obtaining the updated dependent variable.
These updated EV population and mileage figures serve as inputs for the post-planning charging energy simulation.
Annualized carbon emissions from EV and ICEV manufacturing and operation
The annualized carbon emissions calculations in this study focus exclusively on vehicle-side emissions, with the following system boundaries:
Scope: The analysis is confined to vehicle-side emissions, including the manufacturing (vehicle body and battery) and operational phases for both EVs and ICEVs.
Zero-Carbon Charging: Emissions from distributed RE installations are allocated to the building sector. Consequently, EV charging powered by surplus local RE is considered to have zero operational emissions.
Based on the energy charged from RE and from the grid during EV operation, as well as the grid’s carbon emission factor and the carbon emissions from EV manufacturing, the annual life cycle carbon emissions for EVs can be calculated (Equations 21, 22, 23, 24, and 25).
Here, is the annual carbon emissions per is the annual carbon emissions from operation, is the annual carbon emissions from production, and is the annual carbon emissions from battery degradation. is the annual total EV carbon emissions for each city, which is calculated by the carbon emissions per EV multiplied by the number of EV for each city. is the energy charging from the power grid per year per EV, and is the carbon emission factor of the power grid for each city. Massev is the average mass per EV for each city, and CEproduction is the carbon emission factor of production per kilogram. “Service refers to the number of years a vehicle can be used. Capacitybattery is the average EV battery capacity for each city. is the carbon emission factor of EV battery production. Numberbattery refers to the number of batteries each EV will use over its service life. Similarly, the carbon emissions of ICEVs can be determined by considering the emissions from both their operation and manufacturing (Equations 26, 27, 28, and 29).
(Equation 26)
(Equation 28)
Since the overall travel demand in a city remains constant when other conditions are unchanged, an increase in the number and annua mileage of EVs will result in a decrease in the mileage and number of ICEVs. Therefore, the number and mileage of ICEVs can be calculated based on the planned number and mileage of EVs (Equations 30 and 31).
Here, and are the number of vehicles, , and ICEVs for each city, respectively. MilageV, MilageEV, and MilageICEV are the annual mileage of vehicles,60 EVs, and ICEVs for each city respectively. and indicate the total demand for vehicle and travel, which remains the same for each individual city before and after EVCS planning.
The total carbon emissions for all vehicles in each city are the sum of the carbon emissions of EVs and ICEVs, which is calculated in different scenarios.
Detailed data related to carbon emissions calculations can be found in Table and Note S9.58,59,61,63–65
EVCS construction investment and levelized carbon cost
The economic analysis focuses on the upfront capital investment required for the new EVCS infrastructure. Operational costs and revenues are excluded, assuming a break-even operational phase. The tota investment is calculated based on the number of new 60-kW piles installed, at an estimated cost of 15,000 RMB per pile, based on EVCS dealer LV C-CHONG.66 The LCC, a metric for the costeffectiveness of carbon mitigation, is then calculated as the total investment divided by the total annual carbon abatement achieved in Scenario 4.
Comparison of methodology with existing literatur
A detailed comparison of our methodological contributions against ex isting literature is provided in Note S10,15,67,68 further highlighting the novelty of this work.
DATA AND CODE AVAILABILITY
Data and code used to generate the results reported in this study are availabl from the corresponding author upon request.
ACKNOWLEDGMENTS
This work was supported by National Natural Science Foundation of China (NSFC) (52408137) and Guangdong Provincial Natural Science Foundation Gen eral Project (2414050003253 and 2024A1515012166)
AUTHOR CONTRIBUTIONS
Conceptualization, Y. Zheng, Z.D., and Y. Zhou; methodology, Y. Zheng, Y. Zhou and A.S.; software, Y. Zheng and A.S.; data, Y. Zheng, Z.D., A.S., and X.S.; valida tion, Y. Zheng and A.S.; writing – original draft, Y. Zheng and A.S.; writing – re view & editing, Y .Zhou, W.F., and P.S.; funding acquisition, Y. Zhou; supervision Y. Zhou.
DECLARATION OF INTERESTS
The authors declare no competing interests.
SUPPLEMENTAL INFORMATION
Supplemental information can be found online at https://doi.org/10.1016/j. ynexs.2025.100113.
Received: June 23, 2025 Revised: December 9, 2025 Accepted: December 17, 2025 Published: December 19, 2025
REFERENCES
-
Powell, S., Cezar, G.V., Min, L., et al. (2022). Charging infrastructure access and operation to reduce the grid impacts of deep electric vehicle adoption. Nat. Energy 7, 932-945. https://doi.org/10.1038/s41560-022-01105-7.
-
Alhuyi Nazari, M., Blazek, V., Prokop, L., et al. (2024). Electric vehicle charging by use of renewable energy technologies: A comprehensive and updated review. Comput. Electr. Eng. 118, 109401. https://doi.org/10.1016/j.compeleceng. 2024.109401.
-
Chakraborty, P., Parker, R., Hoque, T., et al. (2022). Addressing the range anxiety of battery electric vehicles with charging en route. Sci. Rep. 12, 5588. https:/ doi.org/10.1038/s41598-022-08942-2.
-
Mohammed, A., Saif, O., Abo-Adma, M., et al. (2024). Strategies and sustainability in fast charging station deployment for electric vehicles. Sci. Rep. 14, 283. https://doi.org/10.1038/s41598-023-50825-7.
-
Ullah, Z., Wang, S., Wu, G., et al. (2023). Optimal scheduling and techno-eco nomic analysis of electric vehicles by implementing solar-based grid-tied charging station. Energy 267, 126560. https://doi.org/10.1016/j.energy.2022. 126560.
-
Liang, C., Yang, Q., Sun, H., et al. (2024). Unveiling consumer satisfaction and its driving factors of EVs in China using an explainable artificial intelligence approach. Humanit. Soc. Sci. Commun. 11, 1575. https://doi.org/10.1057/ s41599-024-04120-z.
-
IEA (2023). Electricity Grids and Secure Energy Transitions (IEA)
-
Wu, J., Powell, S., Xu, Y., et al. (2024). Planning charging stations for 2050 to support flexible electric vehicle demand considering individual mobility pat terns. Cell Rep. Sustain. 1, 100006. https://doi.org/10.1016/j.crsus.2023. 100006.
-
Ren, Q., and Sun, M. (2025). Predicting the spatial demand for public charging stations for EVs using multi-source big data: an example from jinan city, china. Sci. Rep. 15, 6991. https://doi.org/10.1038/s41598-025-91106-9
-
Yu, G., Ye, X., Gong, D., et al. (2025). Stochastic planning for transition from shopping mall parking lots to electric vehicle charging stations. Appl. Energy 379, 124894. https://doi.org/10.1016/j.apenergy.2024.124894.
-
Liang, J., Qiu, Y. (Lucy), Liu, P., et al. (2023). Effects of expanding electric vehicle charging stations in California on the housing market. Nat. Sustain. 6, 549-558. https://doi.org/10.1038/s41893-022-01058-5.
-
Zheng, Y., Keith, D.R., Wang, S., et al. (2024). Effects of electric vehicle charging stations on the economic vitality of local businesses. Nat. Commun. 15, 7437. https://doi.org/10.1038/s41467-024-51554-9.
-
Holland, S.P., Mansur, E.T., Muller, N.Z., et al. (2016). Are There Environmenta Benefits from Driving Electric Vehicles? The Importance of Local Factors. Am. Econ. Rev. 106, 3700-3729. https://doi.org/10.1257/aer.20150897.
-
Carley, S., and Konisky, D.M. (2020). The justice and equity implications of the clean energy transition. Nat. Energy 5, 569-577. https://doi.org/10.1038/ s41560-020-0641-6.
-
Chen, Y., Chen, Y., and Lu, Y. (2023). Spatial Accessibility of Public Electric Vehicle Charging Services in China. ISPRS Int. J. GeoInf. 12, 478. https://doi. org/10.3390/ijgi12120478.
-
(2024). Assessing the spatial distributions of public electric vehicle charging stations with emphasis on equity considerations in King County Washington. Sustain. Cities Soc. 107, 105409. https://doi.org/10.1016/j.scs. 2024.105409.
-
Yu, Q., Que, T., Cushing, L.J., et al. (2025). Equity and reliability of public electric vehicle charging stations in the United States. Nat. Commun. 16, 5291. https:/ doi.org/10.1038/s41467-025-60091-y.
-
Mitra, B., Pal, S., Reeve, H., et al. (2025). Unveiling sectoral coupling for resilient electrification of the transportation sector. npj Sustain. Mobil. Transp. 2, 2 https://doi.org/10.1038/s44333-024-00019-z.
-
Logavani, K., Ambikapathy, A., Arun Prasad, G., et al. (2021). Smart Grid, V2G and Renewable Integration. In Electric Vehicles: Modern Technologies and Trends, N. Patel, A.K. Bhoi, and S. Padmanaban, et al., eds. (Springer) pp. 175-186. https://doi.org/10.1007/978-981-15-9251-5_10.
-
Mahmud, K., and Town, G.E. (2016). A review of computer tools for modeling electric vehicle energy requirements and their impact on power distribution networks. Appl. Energy 172, 337-359. https://doi.org/10.1016/j.apenergy 2016.03.100.
-
Brinkel, N., van Wijk, T., Buijze, A., et al. (2024). Enhancing smart charging in electric vehicles by addressing paused and delayed charging problems. Nat. Commun. 15, 5089. https://doi.org/10.1038/s41467-024-48477-w
-
Pang, S., Fan, K., and Huo, M. (2025). Charge and discharge scheduling method for large-scale electric vehicles in V2G mode via MLGCSO. Sci. Rep. 15, 16202 https://doi.org/10.1038/s41598-025-00265-2.
-
Ibrahim, R.A., Gaber, I.M., and Zakzouk, N.E. (2024). Analysis of multidimensional impacts of electric vehicles penetration in distribution networks. Sci. Rep. 14, 27854. https://doi.org/10.1038/s41598-024-77662-6
-
Zhou, Y., Cao, S., Hensen, J.L.M., et al. (2019). Energy integration and interaction between buildings and vehicles: A state-of-the-art review. Renew. Sustain. Energy Rev. 114, 109337. https://doi.org/10.1016/j.rser.2019 109337.
-
Liu, H., and Zhang, A. (2024). Electric vehicle path optimization research based on charging and switching methods under V2G. Sci. Rep. 14, 30843. https:/ doi.org/10.1038/s41598-024-81449-0.
-
Zhou, Y. (2022). Energy sharing and trading on a novel spatiotemporal energy network in Guangdong-Hong Kong-Macao Greater Bay Area. Appl. Energy 318, 119131. https://doi.org/10.1016/j.apenergy.2022.119131.
-
Ma, X., Ma, W., Tao, Y., et al. (2025). Optimizing bus charging infrastructure by incorporating private car charging demands and uncertain solar photovoltaic generation. npj Sustain. Mobil. Transp. 2, 6. https://doi.org/10.1038/s44333- 024-00021-5.
-
Xia, X., and Li, P. (2022). A review of the life cycle assessment of electric vehicles: Considering the influence of batteries. Sci. Total Environ. 814, 152870. https://doi.org/10.1016/j.scitotenv.2021.152870.
-
Nguyen-Tien, V., Zhang, C., Strobl, E., et al. (2025). The closing longevity gap between battery electric vehicles and internal combustion vehicles in Great Britain. Nat. Energy 10, 354-364. https://doi.org/10.1038/s41560-024- 01698-1
-
Ahmadzadeh, O., Rodriguez, R., Getz, J., et al. (2025). The impact of lightweighting and battery technologies on the sustainability of electric vehicles: A comprehensive life cycle assessment. Environ. Impact Assess. Rev. 110, 107668. https://doi.org/10.1016/j.eiar.2024.107668
-
Li, W., Wang, M., Cheng, X., et al. (2025). Travel intensity of private electric vehicles and implications for GHG emission reduction in China. Environ. Impact Assess. Rev. 112, 107770. https://doi.org/10.1016/j.eiar.2024.107770.
-
Kang, H., Jung, S., Kim, H., et al. (2025). Life-cycle environmental impacts of reused batteries of electric vehicles in buildings considering battery uncertainty. Renew. Sustain. Energy Rev. 207, 114936. https://doi.org/10.1016/j rser.2024.114936.
-
Tao, M., Lin, B., and Poletti, S. (2025). Deciphering the impact of electric vehicles on carbon emissions: Some insights from an extended STIRPAT framework. Energy 316, 134473. https://doi.org/10.1016/j.energy.2025.134473
-
Grubler, A., Wilson, C., Bento, N., et al. (2018). A low energy demand scenario for meeting the 1.5 ◦C target and sustainable development goals without negative emission technologies. Nat. Energy 3, 515-527. https://doi.org/10.1038 s41560-018-0172-6
-
Beath, H., Mittal, S., Few, S., et al. (2024). Carbon pricing and system reliabilit impacts on pathways to universal electricity access in Africa. Nat. Commun 15, 4172. https://doi.org/10.1038/s41467-024-48450-7.
-
Luderer, G., Madeddu, S., Merfort, L., et al. (2021). Impact of declining renewable energy costs on electrification in low-emission scenarios. Nat. Energy 7, 32-42. https://doi.org/10.1038/s41560-021-00937-z
-
Song, A., Dan, Z., Zheng, S., et al. (2024). An electricity-driven mobility circular economy with lifecycle carbon footprints for climate-adaptive carbon neutrality transformation. Nat. Commun. 15, 5905. https://doi.org/10.1038/s41467-024- 49868-9.
-
Dan, Z., Song, A., Zheng, Y., et al. (2025). City information models for optimal EV charging and energy-resilient renaissance. Nexus 2, 100056. https://doi.org 10.1016/j.ynexs.2025.100056
-
Yuksel, T., and Michalek, J.J. (2015). Effects of Regional Temperature on Electric Vehicle Efficiency, Range, and Emissions in the United States. Environ. Sci. Technol. 49, 3974-3980. https://doi.org/10.1021/es505621s
-
Shenzhen Municipal People’s Government (2021). Shenzhen Urban Planning Standards and Guidelines. https://www.sz.gov.cn/attachment/1/1133 1133901/10013132.pdf.
-
Gini, C. (1912). Variabilità e Mutabilità: Contributo Allo Studio Delle Distribuzioni e Delle Relazioni Statistiche. [Fasc. I.] (Tipogr. di P. Cuppini).
-
Liu, J., Yang, H., and Zhou, Y. (2021). Peer-to-peer trading optimizations on netzero energy communities with energy storage of hydrogen and battery vehi cles. Appl. Energy 302, 117578. https://doi.org/10.1016/j.apenergy.2021. 117578.
-
Miskin, C.K., Li, Y., Perna, A., et al. (2019). Sustainable co-production of food and solar power to relax land-use constraints. Nat. Sustain. 2, 972-980. https://doi. org/10.1038/s41893-019-0388-x.
-
UW-Madison, SEL (Solar Energy Laboratory, University of Wisconsin-Madison); TRANSSOLAR (TRANSSOLAR Energietechnik GmbH); CSTB (Centre Scientifique et Technique du Bâtiment) (2017). Multizone Building (Type56 – TRNBuild) for the TRNSYS Simulation Environment, Volume 5 Multizone Building Modeling with Type56 and TRNBuild (Solar Energy Laboratory, University of Wisconsin-Madison)
-
World Health Organization Interpretation of Gini index values.
-
Al-Sheddi, A., Kamel, S., Almeshal, A.S., et al. (2023). Distribution of Primary Healthcare Centers Between 2017 and 2021 Across Saudi Arabia. Cureus 15, e41932. https://doi.org/10.7759/cureus.41932.
-
Baidu Map. https://map.baidu.com/.
-
Amap. https://www.amap.com/.
-
Huolala. https://www.huolala.cn/.
-
StarCharge. https://www.starcharge.com/.
-
Che, Y., Li, X., Liu, X., et al. (2024). 3D-GloBFP: the first global three-dimensional building footprint dataset. Earth Syst. Sci. Data Discuss. 2024, 1-28. https:/ doi.org/10.5194/essd-2024-217
-
Che, Y., Li, X., Liu, X., et al. (2024). Building height of Asia in 3D-GloBFP. Zenodo. https://doi.org/10.5281/ZENODO.12674244.
-
China Urban Planning Society (2021). Guidelines for Layout Planning of Electric Vehicle Charging Infrastructure (China Urban Planning Society).
-
China Academy of Urban Planning & Design (2023). Report on the Urban Built Environment Density of Major Chinese Cities (China Academy of Urban Planning & Design).
-
(2003). Meteonorm 5, Asia. Meteotest. https://meteonorm.com/.
-
Csisolar (2019). Hiku-CS3W-450MS. https://static.csisolar.com/wp-content uploads/sites/9/2019/12/07115154/CS-Datasheet-HiKu_CS3W-MS_v5.9_CN.pdf
-
Wang, Z. (2024). Annual Report on the Big Data of New Energy Vehicle in China (2023) (Springer Nature Singapore). https://doi.org/10.1007/978-981-97- 4840-2.
-
China Automotive Technology and Research Center Co., Ltd (2023). Confidential Data on Carbon Emission Factors of China’s Power Grid and EV Annual Mileage.
-
Autohome. https://www.autohome.com.cn.
-
Yiche Research Institute (2023). Driving Mileage Insight Report 2023. https:/ chuban.yiche.com/publiccms/yanjiuyuan.html.
-
Dasouchezhiyun. https://zhiyun.souche.com/.
-
China Electric Vehicle Charging infrastructure Promotion Alliance. https://mp weixin.qq.com/s/LvdyKRC_vI1iHaMd8YQCiA
-
Qiao, Q., Zhao, F., Liu, Z., et al. (2019). Life cycle greenhouse gas emissions of Electric Vehicles in China: Combining the vehicle cycle and fuel cycle. Energ 177, 222-233. https://doi.org/10.1016/j.energy.2019.04.080.
-
Ciez, R.E., and Whitacre, J.F. (2019). Examining different recycling processes for lithium-ion batteries. Nat. Sustain. 2, 148-156. https://doi.org/10.1038 s41893-019-0222-5
-
Gasper, P., Prakash, N., and Smith, K.. BLAST-Lite. National Renewable Energ Laboratory. https://github.com/NREL/BLAST-Lite
-
LV C-CHONG. https://bdppgg.lbbtech.com/.
-
Jiao, J., Choi, S.J., and Nguyen, C. (2024). Toward an equitable transportatio electrification plan: Measuring public electric vehicle charging station access disparities in Austin, Texas. PLoS One 19, e0309302. https://doi.org/10 1371/journal.pone.0309302
-
Ju, Y., Wu, J., Su, Z., et al. (2025). Trajectory-Integrated Accessibility Analysis o Public Electric Vehicle Charging Stations. Preprint at arXiv. https://doi.org/10 48550/arXiv.2505.12145.
Figure. 1. Overall process flowchart
Publication Details
Journal
Nexus
Publication Year
2026
Authors
Yuyu Zheng, Aoye Song, Zhaohui Dan, Xin Sun, Shuncheng Lee, Wei Feng, Pengyuan Shen, Yuekuan Zhou
Categories
Building energy prediction and management