
Real-time optimization of a dynamic solar PV integrated shading design with data-driven reactive control and spatial daylighting prediction
Hao Zhang, Zheng Wang, Bicui Ye, Yuekuan Zhou, Xue Liu, Yi Zhang, Pengyuan Shen
2026
Building and Environment
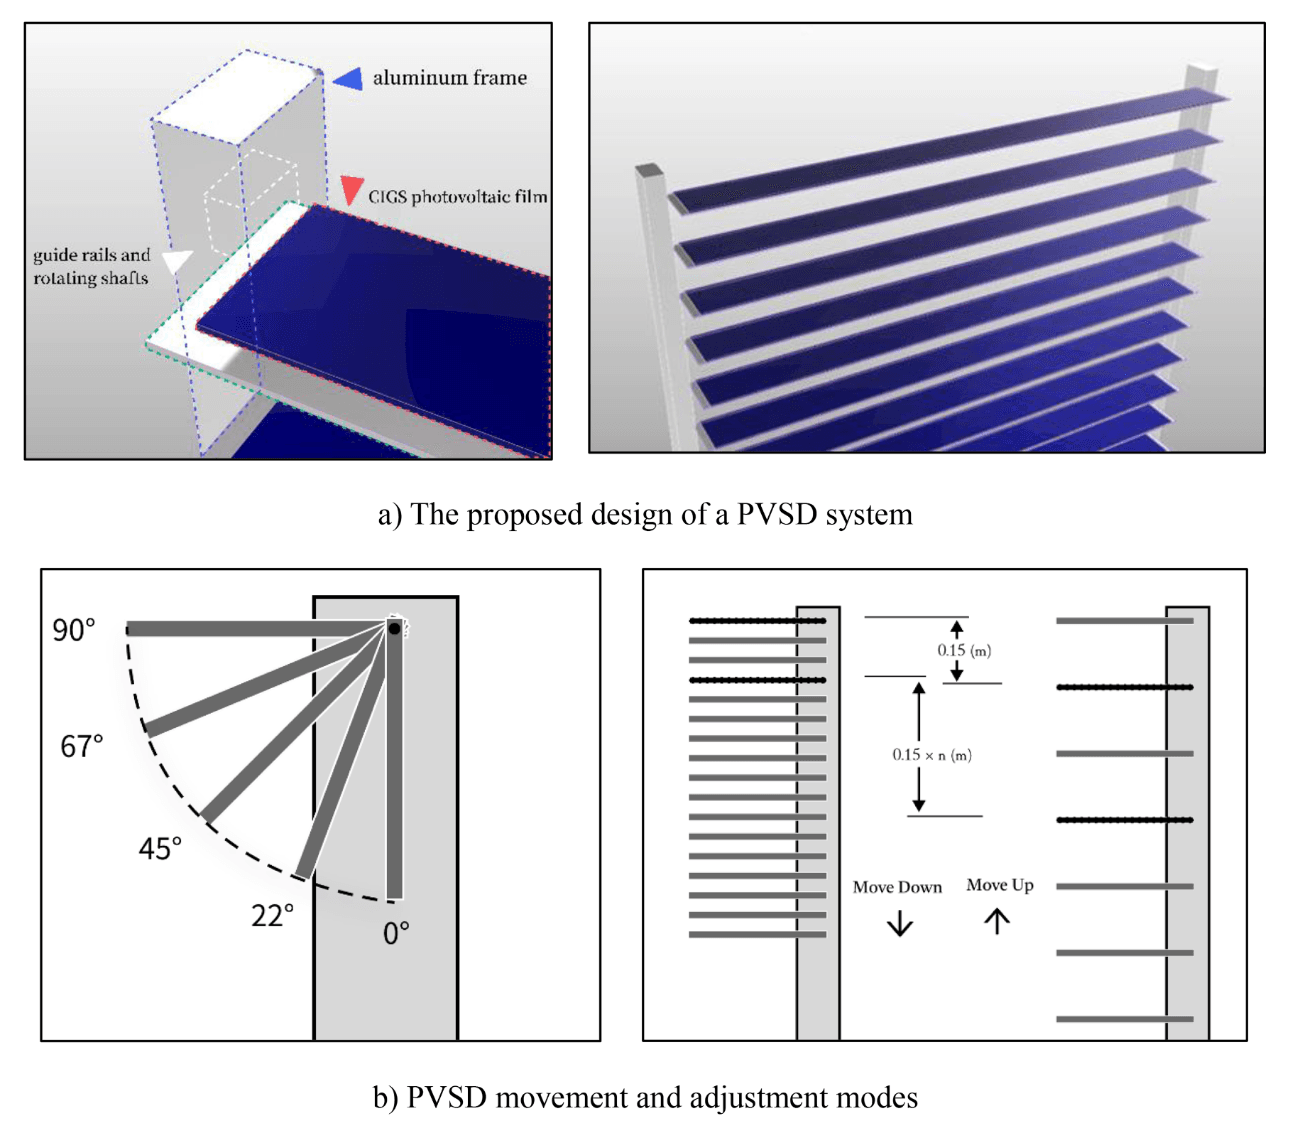
Fig. 1. The proposed PVSD system in this study.
Summary
This paper proposes a high-degree-of-freedom photovoltaic shading device (PVSD) with vertical translation and rotation. A Random Forest surrogate model fast predicts spatial daylight metrics, enabling real-time PSO multi-objective optimization balancing illuminance, glare control, visual openness and PV output. Simulations of a Shenzhen office show integrated control cuts annual net energy use by 52%, lifts useful daylight ratio to 0.79 and nearly eliminates glare, well reconciling on-site power generation and indoor visual comfort.
Abstract
This study proposes a high-degree-of-freedom photovoltaic shading device (PVSD) with 255 distinct configurations through combined vertical translation and single-axis rotation. Machine learning models trained on computational simulations achieve R² of 0.984 and RMSE of 0.039 for spatial daylight metrics, reducing computation time significantly. This enables real-time reactive optimal control integrating particle swarm optimization to balance indoor illuminance, glare protection, visual connectivity, and photovoltaic generation. Performance evaluation in a Shenzhen office demonstrated substantial improvements: spatial Useful Daylight Illuminance increased from 23% to 79%; near-complete glare protection achieved with spatial Daylight Glare Probability of 0.95; net energy consumption reduced by 52%; and annual electricity generation reached 850 kWh. The integrated optimization strategy maintained 92% of maximum photovoltaic generation (under energy production priority strategy) while delivering superior daylight quality. These results demonstrate that high-degree-of-freedom PVSDs with intelligent data-driven control can transform building facades into adaptive energy-generating systems, offering a practical pathway toward net-zero energy buildings.
1. Introduction
Buildings account for approximately 30% of global energy con sumption and 28% of emissions [1], making building energy efficiency crucial for achieving carbon neutrality targets. As urbanization accelerates and the global population increasingly shifts to cities, the energy demand from buildings is of great concern in the future unless significant interventions like building energy retrofit are implemented [2]. This escalating energy consumption, coupled with the urgent need to mitigate climate change and urban climate challenges, has placed building energy efficiency at the forefront of sustainable development strategies.
The building envelope, particularly glazed surfaces, plays a critical role in energy performance. While windows provide natural daylight and psychological benefits, they also represent over half of total energy losses in conventional buildings [3]. Climate change may further complicate the challenge of building envelope design. Rising global temperatures, increased frequency of extreme weather events, and shifting seasonal patterns demand adaptive solutions that can respond to varying and unpredictable environmental conditions [4]. This context has catalyzed the development of adaptive building envelopes that can modulate their properties in response to changing environmental conditions and occupancy needs [5].
The shading devices in buildings can improve indoor visual comfort by controlling direct light. Appropriate indoor illuminance, glare control, and views are highly correlated with visual satisfaction [6] and comfort [7], mental health [8], and job satisfaction [9]. Meanwhile, windows are responsible for over 40% of heat gain or loss in buildings, with approximately 82% of solar radiation transmitted through transparent glass [10]. Therefore, shading devices play a crucial role in building energy efficiency [11,12]. Traditional fixed shading creates trade-offs between thermal and visual comfort. Insufficient shading causes glare and cooling loads, while excessive shading increases artificial lighting demand. This challenge has driven development of adaptive shading systems that respond dynamically to environmental conditions [13]. Photovoltaic shading devices (PVSDs) represent a promising solution combining solar control and energy generation [14]. By integrating photovoltaic modules into shading systems, PVSDs reduce cooling demand while generating electricity, enhancing building energy self-sufficiency [14]. This dual functionality addresses both energy demand reduction and on-site renewable generation, potentially achieving net-zero energy performance.
However, PVSD integration introduces optimization challenges. Maximizing power generation often conflicts with optimal daylighting, as photovoltaic panels perform best perpendicular to solar radiation, which may not provide ideal interior conditions. The dynamic nature of solar geometry necessitates sophisticated control strategies balancing multiple objectives in real-time. Recent advances in smart building technologies and machine learning offer new opportunities for PVSD control [15]. Data-driven models can predict optimal configurations based on environmental conditions and occupancy patterns, enabling proactive rather than reactive control strategies [16]. Despite these possibilities, challenges remain in computational complexity, predictive accuracy, and multi-objective integration.
This study addresses these challenges by proposing a novel high degree-of-freedom PVSD system with reactive optimal control based on machine learning. The system enables precise adjustment through vertical positioning and angular rotation, offering unprecedented flexibility in balancing daylighting quality, glare control, visual connectivity, and photovoltaic generation. The integration of data-driven predictive models with multi-objective optimization represents a significant advancement in adaptive building envelope technologies.
2. Literature review
Recent studies have demonstrated the feasibility of various PVSD designs, including fixed, adjustable, and adaptive types. These devices can effectively balance indoor lighting quality and shading efficiency [17]. However, the performance of PVSDs greatly depends on their geometry, control logic, and adaptability to environmental changes [18].
2.1. Review of PVSD research development
To systematically evaluate the state of the art in PVSD research and identify critical gaps, we conducted a comprehensive review of representative studies in recent years. Table 1 summarizes key characteristics of these studies including location, PVSD form, photovoltaic material, optimization objectives, and simulation tools employed. The chrono logical progression of research reveals important trends in the field's
evolution.
Early PVSD research from 2014 to 2016 primarily focused on eval uating fixed shading configurations with limited geometric flexibility. Mandalaki et al. [19] evaluated thirteen types of fixed external shading forms in Greece using polycrystalline modules, examining energy consumption, daylight autonomy (DA), useful daylight illuminance (UDI), and daylight glare index (DGI) through Ecotect and Daysim simulations. Similarly, Bahr [20] studied external horizontal louvers in Abu Dhabi using both crystalline and amorphous silicon, focusing on cooling load reduction, power generation, and economic performance. These early studies established the fundamental trade-offs between energy generation and thermal/visual comfort but were constrained by static geometries that could not adapt to varying solar conditions throughout the day or across seasons. Table 1 shows that studies from this period [19–26] predominantly used fixed configurations, with only Saranti et al. [22] introducing removable vertical panels that could be manually adjusted.
The period from 2017 to 2019 marked a transition toward greater geometric flexibility and computational sophistication. Jayathissa et al. [36,38] pioneered adaptive BIPV shading systems with diamond-shaped patterns, demonstrating that movable configurations could achieve 20–80% net energy savings compared to static shading depending on HVAC system efficiency. This work employed advanced simulation frameworks including Rhino, Grasshopper, Ladybug, Radiance, and Python, enabling parametric exploration of design space. This computational advancement enabled researchers to evaluate hundreds of configurations systematically rather than evaluating a handful of predetermined designs. Luo et al. [35,39,51] conducted experimental research on photovoltaic louvers integrated into double-skin facades using amorphous silicon (a-Si), demonstrating the desirability of adaptive control strategies through measured thermal and electrical performance data. However, Table 1 reveals that even during this transitional period [33–40], few studies implemented truly dynamic control systems with real-time optimization capabilities.
Recent research from 2020 to 2023 has increasingly emphasized optimization methods and control strategies. Liu et al. [46] proposed a PVSD design method integrating geometric optimization with an adaptive control model (ACM) for an office building in Guangzhou, achieving 48.7% reduction in cooling and lighting demands, 1034.4 kWh annual electricity generation, and 71.6% improvement in UDI. This study employed Python and EnergyPlus for integrated simulation, representing a shift toward computational optimization frameworks. Ma et al. [47] analyzed external inclined unidirectional louvers using Ladybug and Honeybee, focusing on indoor light environment and energy con sumption optimization. Ding et al. [52] developed a multi-system collaborative control framework called OCTOPUS based on deep reinforcement learning (DRL), enabling joint optimization of HVAC, lighting, blinds, and windows with a novel reward function balancing energy use and occupant comfort. However, Table 1 does not include this study as it focused on general blind control rather than PVSD-specific applications. When it comes to the most recent studies from 2024–2025, it shows emerging progress in addressing these limitations. Zheng et al. [12] proposed a multi-layered adjustable semi-shading system for subtropical climates, achieving 49–53% reduction in glare probability through year-round simulation-based optimization. Zhao and Gou [49] advanced semi-transparent BIPV window design using K-means clustering to balance energy harvesting, daylight sufficiency, and glare control, achieving a 15.63% increase in annual illuminance. Roshan Kharrat et al. [50] demonstrated that geometrically complex adaptive designs could achieve 485 kWh higher energy production while maintaining optimal daylight factors (2.1–2.9%) and 94% visual comfort compliance. Ito and Lee [48] employed NSGA-II genetic algorithms to optimize curved louver geometry with flexible solar panels, demonstrating that designs prioritizing solar irradiation maximization yield the lowest operational energy consumption.
Table 1 PVSD Related Research Review.
Table 1 (continued )
Recent studies have further advanced multi-objective optimization approaches for shading systems. Baghoolizadeh et al. employed NSGA-II for optimizing Venetian blinds in office buildings to balance electricity consumption with visual and thermal comfort using JEPLUS tool with 21 involved design variables [53]. Chen et al. provided a comprehensive review of BIPV system integration challenges and opportunities recently concluding that the tilt angle of PV shading, window to wall ratio, transmittance, and orientation are leading parameters that determines BIPV system performance [54]. Research optimized residential PV shadings for optimal electricity consumption and production and found that a 20-degree tilt angle is the best choice for PV shading in Tehran, Iran to reduce annual electricity consumption for their case study building [55]. Researchers also examined photovoltaic shading opti mization across European climates considering energy cost implications, revealing 17% to 34% building electricity consumption cost can be saved on the annual bill [56]. Miraba et al. developed adaptive BIPV shading optimization addressing electricity generation alongside sDA and DGP metrics using multi-objective algorithms and found adaptive BIPV can boost annual PV power generation by up to 200% [57]. Zhang et al. investigated vertical and horizontal solar shading optimization in residential buildings by including 9 design variables for power output maximization while reducing electricity usage [58]. Despite these advances, the fundamental challenge of achieving high-degree-of-freedom systems with thousands of possible configurations for true multi-objective optimization remains unresolved.
2.2. Research gaps and motivation of this study
Analysis of the thirty-four studies in Table 1 reveals four critical limitations that constrain current PVSD technology and impede progress toward truly adaptive, high-performance systems. First, limited degrees of freedom. Table 1 demonstrates that approximately 70% of studies employed fixed configurations with zero degrees of freedom. Of the remaining dynamic systems, only three [22,44,46] achieved more than simple binary states. Even advanced movable systems offer limited configuration options: Jayathissa et al.’s diamond-shaped panels [36] provided approximately 10–20 discrete positions through facade tracking, Akbari Paydar’s movable folding plates [44] offered binary deployment states, and Zheng et al. [12] investigated 12 configurations with varying slat numbers and rotation angles. No existing study demonstrates a PVSD system with greater than one hundred configurations, let alone the thousands needed for true multi-objective optimization across daily and seasonal variations. Critically, no study combines both vertical translation and rotation to achieve the geometric flexibility required for comprehensive optimization across 8760 annual operating hours.
Second, lack of real-time intelligent control. While several studies mention “adaptive” control [41,44,46], the simulation tools column reveals that implementations rely on predetermined schedules or simple sensor thresholds rather than real-time optimization. Liu et al. [46] employed Python and EnergyPlus but computed optimal configurations offline for typical conditions rather than responding to actual real-time weather. Existing research rarely demonstrates real-time optimization based on predictive models that can anticipate and respond to changing conditions while balancing multiple objectives dynamically within computational time constraints suitable for hourly building control updates. The simulation tools column shows that while recent studies [46,47] increasingly employ Python suggesting programmatic control potential, few integrate machine learning surrogate models with global optimization algorithms necessary for real-time multi-objective control.

Third, insufficient integration of multi-objective optimization. The opti mization objectives column reveals that studies typically prioritize either energy generation [20,21,25,29–32,37,41,44,46] or visual comfort [18,19,27,39,45,47], rarely achieving optimal balance among illuminance quality, glare protection, view preservation, and power generation simultaneously. Most studies focus primarily on energy consumption or power generation with daylight metrics (DA, UDI) evaluated separately rather than optimized concurrently. The few studies attempting multi-objective optimization [36,38,44] use simplified weighting schemes without user-adaptive capabilities or quantitative validation of Pareto-optimality. The complete absence of view quality (openness factor or similar metrics) as an explicit optimization objective in Table 1 represents a significant oversight given its importance for occupant satisfaction, productivity, and wellbeing, with only qualitative mentions of “visual comfort” appearing sporadically.
Last but not least, limited validation of machine learning applications. Despite the potential of data-driven approaches increasingly recognized in recent building science literature, Table 1 shows that only the most recent studies employed Python suggesting computational sophisticat ion, yet few documented comprehensive development, validation, and implementation of machine learning models specifically for predicting
PVSD performance metrics (sUDI, sDGP) in real-time control applica tions. The simulation tools column reveals continued reliance on timeintensive physics-based simulation such as EnergyPlus, TRNSYS, Radi ance, or Daysim without surrogate modeling approaches that could enable the rapid performance prediction necessary for real-time optimization.
To address these identified limitations, this study proposes a novel high-degree-of-freedom PVSD that enables over 2000 adjustable configurations via combined louver translation and rotation. A data-driven prediction model is developed to evaluate indoor daylight metrics with millisecond-level inference suitable for real-time control, and a reactive optimal control (ROC) method is implemented to achieve true real-time multi-objective optimization. The system is validated under Shenzhen’s climate in a general office space and evaluated for its effectiveness in improving lighting quality, glare protection, view openness, and energy performance, addressing all four critical gaps identified in the literature.
3. Methodology
3.1. Design of a high-degree-of-freedom PVSD system
This study proposes a PVSD, as shown in Fig. 1a, which is an improved version of the traditional Venetian louver shading form, while Fig. 1b shows the available movement and adjustment possibilities of the proposed PVSD system. The system can achieve high-degree-offreedom shading control through the constrained movement of up and down folding and single-axis rotation, thereby achieving a balance between various light comfort and energy consumption indicators, and switching between multiple targets. This PVSD is composed of two side slide rails, aluminum support components, and photovoltaic films. The two side slide rails are equipped with built-in rotating shafts to achieve the rotation and folding control of the PVSD.
a) The proposed design of a PVSD system

b) PVSD movement and adjustment modes
Fig. 1. The proposed PVSD system in this study.
Aluminum support components are chosen because of their excellent electrical conductivity and low density, which can reduce the energy consumption required for deformation, lower the loss during energy transmission and help dissipate heat for photovoltaic films. Photovoltaic films are chosen because of their lower cost, increasingly improved power generation efficiency, and lower density, which can effectively reduce equipment wear caused by deformation. The sunshade blades adopt a combination of double-sided guide rail sliding and single-axis rotation of the rotating shaft. They can move up and down in the guide rail and achieve rotational adjustment with the help of the rotating shafts on both sides, thereby meeting the light requirements of different angles and heights. This design enables the shading device to be applicable to various window types. Through an integrated circuit control system, photovoltaic power generation and energy storage modules, it realizes intelligent shading adjustment, self-supply of energy and energy storage management.
As shown in Fig. 1b, the high degrees of freedom are defined as up and down folding (±0.14 m, 29 degrees of freedom) and single-axis rotation (10-degree step changes ranging from 0◦ to 90◦ results in 10 degrees of freedom). Through collision exclusion calculations that eliminate physically impossible position-angle combinations where louvers would intersect (35 cases), 255 effective configurations were identified. This represents a substantial increase over conventional systems offering fewer than 10 discrete states, enabling more detailed and accurate natural light control to meet the demands for indoor nat ural light, field of vision and photovoltaic power generation in more scenarios.
According to the latest technical parameters of CIGS films [33], the technical data of photovoltaic modules used in this study are shown in Table 2. Through the series connection of the same layer of photovoltaic films and the parallel connection between the upper and lower layers, photovoltaic louvers of varied sizes are achieved. Based on the basic module (0.03 m) of traditional Windows, in this study, the photovoltaic louvers are set at 0.15 m, with the width being consistent with that of the window to achieve complete shading of the window, thereby realizing usage scenarios such as privacy protection that require full shading.
3.2. Typical individual office space
Archetype models for typical building space are frequently used in research to demonstrate the effect of emerging technology on building energy performance [59,60]. In this research, taking the general office space in Shenzhen as an archetype, the general office space here refers to the space that may be used for various production activities such as office work, rest, and negotiation, or certain "multi-functional Spaces". The usage scenarios of this type of space are diverse, without clear and fixed functions, and it attaches significant importance to the creation of the overall environment of space. This kind of space is increasingly appearing in office buildings [61].
Table 2
Performance of CIGS photovoltaic thin film.
- open-circuit voltage.
- short-circuit current.
Pm - maximum power.
- Maximum power point voltage.
- Maximum power point current.
- standard temperature.
The typical space applied in the research is shown in Fig. 2, with a height of 3.7 m, a width of 4 m and a depth of 5.5 m The detailed building simulation parameters including envelope thermal properties, HVAC system specifications, internal load assumptions, and surface reflectance is detailed in Appendix I. Located on the middle floor of the office building, one side is an exterior wall with Windows that are 2.1 m wide and 2.4 m high. The Ideal Loads Air System provided by EnergyPlus was adopted in the experiment, that is, it was assumed that other hot zones had the same air temperature. Therefore, other surfaces of this space were set as insulation surfaces. This simplified boundary condition approach was deliberately selected to isolate the thermal effects of the PVSD system on the south-facing facade without confounding factors from adjacent zone interactions, following archetype modeling practices commonly employed in proof-of-concept studies evaluating emerging facade technologies [12,46,62]. While this assumption may affect absolute thermal load magnitudes, it preserves the validity of comparative assessments between different shading control strategies, which is the primary objective of this research.
The experimental site was set up in Shenzhen, China. Shenzhen is located in the south of China (about 22.5◦N) and has a subtropical monsoon climate. It is warm and humid in summer, often accompanied by strong sunlight. This climatic condition requires that buildings in Shenzhen effectively reduce the heat accumulation caused by solar radiation, avoid excessively high indoor temperatures, and ensure the comfort of the living and working environment. The average annual temperature in Shenzhen is . The demand for cooling energy is high in summer and there is no demand for heating energy in winter. The demand for shading is high in summer. The maximum and mini mum solar altitude angles throughout the year are 85.05◦ and 0.02◦, respectively. The weather data applied in the simulation and model training in this study were all derived from the typical meteorological Year (TMY) data.
3.3. Optimization objective
In this study, the optimization objectives used for balance include indoor lighting environment (surface illuminance and glare protection), field of view, and photovoltaic power generation. Through the allocation of weights for different optimization objectives, it can adapt to various space usage scenarios.
3.3.1. Spatial useful daylight illuminance(sUDI)
At present, UDI is widely used in the assessment of spatial illuminance. Its meaning is the percentage of the illuminance level at a certain point indoors within a specific range within a certain period of time [63]. This range is usually defined as a light level that is neither too bright nor too dark, that is, the proportion of time in a year when the illuminance at a specific location within a building reaches between 100 and 2000 lx. The definition of this range is based on extensive research on the comfort and efficiency of indoor light environments [64]. UDI is often used to evaluate the proportion of time in which the illuminance of an entire space meets a certain range on a monthly or annual basis. When the time scale is reduced to 1 hour, the calculation method of UDI needs to be adjusted. Therefore, in this study, sUDI (Spatial Useful Daylight Illuminance) was applied as the standard to evaluate the light environment level at a certain indoor location. In this study, sUDI is defined as the proportion of the spatial area that meets the illuminance standard at a certain moment. The specific calculation method is to divide the working plane 0.75 m above the ground into several points and calculate the proportion of points in the space that meet the illu minance standard, so as to optimize the shading form within this hour.

Fig. 2. Representative individual office space in Shenzhen.
Furthermore, since illuminance is significantly correlated with solar heat absorption, considering another purpose of shading is to reduce indoor irradiation and thereby lower the overall building energy consumption [65]. Therefore, in this study, a range of 200–800 lx was selected as the criterion for effective illuminance. And based on this, the shading form at specific times was optimized.
3.3.2. Spatial daylight glare probability (sDGP)
At present, there are mainly two methods for evaluating indoor glare, namely the Glare Index (DGI) and the probability of Glare (DGP). Several studies in recent years have shown that DGP is a more reliable indicator for evaluating the probability of indoor glare than DGI [66]. Since the evaluation index of DGI was first introduced from the results of large-area artificial light sources, its results are usually higher than the glare values in the actual environment [67]. In this study, sDGP (Spatial Daylight Glare Probability) was applied to evaluate the indoor glare probability. Its idea is the same as sUDI, that is, to calculate the glare probability by simulating the HDR image of the user's field of view at a certain moment, converting the measurement dimension from time to space, and determining the impact of glare on space at a specific moment.
3.3.3. Openness factor(OF)
The view outside the window has a profound impact on both physical and mental health [68]. It not only has a series of positive effects on health and well-being [69], but also enhances the cognitive performance and spatial satisfaction of space users [70], reduces discomfort and stress, and has a positive effect on emotions [71]. Therefore, in this study, the Openness Factor (OF) is adopted as the optimization objective, and the balance between the field of vision and the shading effect is achieved through the design of the shading system. It refers to the ratio of the opening area passing through the shading line of sight to the total area inside the room, reflecting the transparency of the shading system. This index is used to quantify the extent to which the external landscape is seen through the shading device. In this study, this indicator is used to measure the average proportion of the rays towards the window at a midpoint 0.75 m above the ground in the space that are not blocked by the shading system.
3.3.4. Photovoltaic generation(ppg)
Photovoltaic systems are widely used around the world to generate clean energy. The performance of photovoltaic modules depends on several factors, including the availability of solar radiation and conversion efficiency. To predict the efficiency of photovoltaic systems, it is crucial to model the thermal and electrical characteristics of photovol taic modules.
A large number of studies have shown that the I-V and P-V charac teristic curves derived from the parameters of the diode model play a decisive role as direct indicators of the performance of solar cells or modules [72,73]. In recent years, the most frequently used models in the literature for estimating photovoltaic I-V curves are the single-diode model (SDM) and the double-diode model (The Double-diode Model). DDM, the modified double-diode model (MDDM), and the three-diode model (TDM). According to existing research, DDM is judged to be almost used to represent the equivalent circuit of solar panels. However, this model has a long computing time and nonlinear relationships among different parameters. Considering the simplicity of SDM, many studies have proved that SDM is the most common, and at the same time, this model is very accurate according to the changes of solar radiation and temperature [74]. Therefore, the equivalent single-diode model is adopted in the study to model photovoltaic power generation. The calculation formula for power generation considering the influence of photovoltaic surface temperature and surface irradiance is as follows:
Based on the equivalent circuit model, the Perze sky model is studied and applied to calculate the irradiance of the photovoltaic surface and the Angle between the sunlight and the photovoltaic panel, so as to simulate the photovoltaic power generation more accurately and apply it to the subsequent optimization algorithm [75]. The total irradiance I on the surface of photovoltaic panels consists of three parts: direct radiation diffuse radiation The calculation equation is as follows:
The occlusion calculation is based on the geometric method as shown in Fig. 3. The sun vector is decomposed into vectors in the horizontal and vertical directions, and then the occlusion is calculated respectively for the horizontal and vertical directions. Among them, horizontal shading can be simply solved by comparing the horizontal Angle with the photovoltaic spacing, while the vertical shading needs to be compared with the vertical Angle and solved on a case-by-case basis. The calcu lation formula is as follows:
3.4. Data-driven model development
3.4.1. Data acquisition
The traditional process of light environment prediction requires simulation-based calculation of geometric and mathematical models, which is computationally inefficient and impractical for optimization systems requiring immediate response. Conventional ray-tracing simulations using ClimateStudio require approximately 15 min per configuration to complete annual hourly dynamic simulation with acceptable accuracy, making real-time iterative optimization computationally prohibitive. This study therefore applies machine learning methods to train data-driven surrogate models that approximate the complex light environment simulation process with real-time inference possibility.
To generate the training dataset, an automated parametric modeling workflow was developed using Grasshopper to systematically adjust PVSD geometric parameters across all physically valid configurations. A total of 255 effective configurations were obtained through collision exclusion calculations that eliminate physically impossible positionangle combinations where louvers would intersect each other or the window frame, spanning vertical positions within ±0.14 m and rotation angles from 0◦ to 90◦ For each of the 255 valid configurations, Clima teStudio performed annual hourly dynamic daylight simulations following the Radiance-based three-phase method, with settings opti mized for accuracy. ClimateStudio has demonstrated illuminance prediction accuracy within ±15% compared to field measurements across diverse building geometries and sky conditions. Each annual simulation required approximately 15 min per configuration on a standard workstation (Intel Core i7 processor, 32 GB RAM), reflecting the computational demand of the Radiance-based three-phase method at the specified accuracy settings applied to all annual hourly timesteps. Across all 255 valid configurations, the total simulation time was approximately 56 to 64 with variation arising from differences in geometric complexity across configurations. The complete Grasshopper and ClimateStudio simulation file is provided as supplementary material.
Based on Shenzhen's climate conditions, solar availability analysis identified 4417 representative hourly timesteps throughout the year when direct normal irradiance exceeded 50 , below which electric lighting dominates regardless of shading configuration. This threshold was determined through preliminary simulations showing that configurations with DNI below 50 achieved sUDI below 0.15 regardless of louver position or angle, indicating insufficient daylight availability for meaningful optimization. By extracting simulation results for each of the 255 configurations at these 4417 timesteps, a dataset of 1126,335 simulation pairs (sample size) was generated for machine learning model training and validation. It is important to note that the 255 effective configurations represent the mechanically realizable design space of the physical device after collision exclusion and the 1126,335 simulation pairs constitute the full dataset for machine learning model training, validation, and testing.
Prior to metamodel training, Sobol sensitivity analysis was conducted using ClimateStudio simulations to identify which of the eight candidate input parameters most significantly influence sUDI and sDGP, thereby guiding feature selection for the surrogate models. Feature selection was conducted using Sobol sensitivity analysis, a variance-based global sensitivity method that decomposes output variance into contributions from individual parameters and their interactions [76]. The detailed methodology and sample size justification [77,78,80] for this analysis are presented in Appendix II. The eight candidates evaluated were shading position, shading angle, solar azimuth, solar altitude, direct normal irradiance (DNI), diffuse horizontal irradiance (DHI), outdoor dry-bulb temperature, and wind speed. The analysis demonstrated that the five selected features, namely shading position, shading angle, solar azimuth, solar altitude, and DNI, collectively account for 96.9% of first-order variance in sUDI and 93.8% in sDGP. While the excluded features showed low first-order indices, DHI and outdoor temperature exhibited notable interaction effects with solar altitude and DNI, as reflected in their total-order indices. However, even including these interactions, the excluded features contribute less than 4% of total variance, which was deemed insufficient to justify additional model complexity. To predict the sUDI and sDGP indicators characterizing the indoor light environment, two independent machine learning models were trained. Table 3 presents the feature vectors and prediction targets, with the feature vector including five environmental and geometric parameters: shading position (vertical translation, −0.14 to +0.14 m), shading angle (rotation, 0 to 90◦), solar azimuth angle (0 to 1.48 radians), solar altitude angle (1.15 to 5.15 radians), and direct solar radiation (0 to 892 W/m²). Independent models were trained for each target to optimize prediction accuracy and enable flexible multi-objective control strategies.

a) Horizontal Shading

b) Vertical Shading
Fig. 3. Calculation method of mutual shading of solar victors.
Table 4
Table 3
The characteristics and predicted values of data-driven models.
3.4.2. Data processing
The compiled dataset integrates all generated simulation results into structured arrays, with each record containing the five-dimensional feature vector (position, angle, azimuth, altitude, radiation), corresponding sUDI value, and sDGP value. Table 4 presents the statistical properties and distribution of the cleaned dataset.
To ensure optimal model performance and prevent scale-related bias, a comprehensive preprocessing pipeline was implemented:
a) Feature Scaling. Standardization was applied to all input features using z-score normalization:
where μ and σ represent the mean and standard deviation of each feature calculated from the training set. This transformation ensures each feature has zero mean and unit variance, preventing features with larger numeric ranges (e.g., solar radiation: 0–892 W/m²) from dominating the learning process compared to features with smaller ranges (e.g., shading position: −0.14 to +0.14 m). Standardization parameters were preserved and applied consistently to validation and test sets to prevent data leakage.
b) Train-Test-Validation Split. The dataset was partitioned using stratified sampling to ensure representative distribution across all conditions:
• Training set: 70% (788,435 samples) - used for model fitting
• Validation set: 15% (168,950 samples) - used for hyperparameter tuning and model selection
• Test set: 15% (168,950 samples) - held out for final performance evaluation, never used during training
Stratification was performed across three dimensions: (1) season (4 bins), (2) solar altitude angle (5 bins), and (3) shading configuration density (3 bins: compact, dispersed, mixed). This ensures each subset contains representative samples from all operating conditions, preventing temporal or geometric bias in model evaluation.
3.4.3. Machine learning algorithms and modeling
Eight algorithms were evaluated to identify optimal prediction models for sUDI and sDGP, spanning the bias-variance tradeoff spectrum from high-bias linear models to high-variance ensemble methods. The evaluated algorithms include Linear Regression, Lasso, Ridge, and ElasticNet as linear baselines, polynomial regression to capture nonlinear relationships, Multi-Layer Perceptron (MLP) neural network, and tree-based ensemble methods including XGBoost, Decision Tree, and Random Forest.
Hyperparameter optimization was conducted using grid search across predefined parameter grids for each algorithm. For Random Forest, the search space included number of estimators (50, 75, 100, 125, 150), minimum samples split (2, 5, 10), minimum samples leaf (1, 2, 4), maximum depth (None, 10, 20, 30), maximum features (sqrt, log2, None), and bootstrap (True, False). For XGBoost, the search included learning rate (0.1, 0.3, 0.5), maximum depth (4, 6, 8, 10), number of estimators (80, 100, 120), regularization alpha (0, 0.1, 1), and column sample by tree (0.8, 1.0). For MLP, hidden layer sizes (25, 50, 100), activation functions (ReLU, tanh), and maximum iterations (500, 1000) were evaluated. Five-fold cross-validation with stratified sampling was employed to ensure robust performance estimates. Stratification was performed across seasonal conditions (4 bins corresponding to quarters), solar altitude angles (5 bins from low to high), and shading configuration density (3 bins: compact, dispersed, mixed). This ensures each fold contains representative samples from all operating conditions, preventing temporal or geometric bias in performance estimation. Table 5 presents the optimal hyperparameter configurations identified through this process along with corresponding performance metrics on the heldout test set.
It is shown that the linear models achieved R² of 0.31, confirming the inherently nonlinear relationship. Polynomial regression reached R² of 0.82, while neural networks achieved R² of 0.80. Tree based methods
sUDI and sDGP dataset distribution and statistical properties.
Table 5
Comprehensive Model Performance Comparison for sUDI Prediction.
demonstrated superior performance with XGBoost at of 0.925, Decision Tree at of 0.96, and Random Forest achieving the highest R² of 0.984 with RMSE of 0.039. Random Forest was selected as the final model due to its exceptional accuracy and 8 ms inference time suitable for real time control. Independent validation tests confirmed robust generalization: temporal extrapolation achieved of 0.981, configuration extrapolation achieved R² of 0.978, and extreme condition testing achieved R² above 0.976 across all radiation ranges. To further illustrate the predictiveness of various models, Fig. 4 presents scatter plots for all algorithms, demonstrating Random Forest achieves tightest clustering around the diagonal with minimal scatter across the full sUDI range.

Fig. 4. Scatter plot of all trained model validation-sUDI.

Random Forest's superiority stems from non-parametric flexibility capturing arbitrary relationships without functional form assumptions, natural interaction modeling through tree splits (e.g., shading angle effectiveness varying with solar altitude), robustness to outliers through ensemble averaging, and interpretable feature importance. Practically, 8 ms inference enables 450 evaluations per second, which is sufficient for 10 particles × 10 iterations × 4 objectives = 400 evaluations, deterministic predictions ensure reproducibility, and 45 MB memory enables embedded deployment.
Moreover, our feature importance analysis revealed distinct patterns for each objective. For sUDI prediction, direct solar radiation dominates at 42.3%, followed by solar altitude at 24.1% and shading angle at 18.7%. For sDGP prediction, shading angle dominates at 38.9%, followed by solar altitude at 27.4% and direct radiation at 19.1%. The complementary hierarchies explain why integrated optimization approaches Pareto-optimal solutions as the objectives are controlled through partially independent mechanisms. This informs hierarchical control: during high radiation, prioritize angular control that optimizes glare simultaneously; during low radiation, prioritize position control that maximizes daylight penetration.
a) Scattered plots for comparison between predictions and simulated results in Shanghai and Beijing


b) Overall cross-climate prediction performance of the data driven model
Fig. 5. Cross-climate performance and validation of the developed data-driven model.
3.4.4. Cross-climate model validation
To validate that the trained model’s generalizability to cities other than Shenzhen-specific patterns, cross-climate generalization testing was conducted using independent physical simulations. The models trained exclusively on Shenzhen data (22.5◦N, subtropical monsoon climate) were applied to predict sUDI and sDGP for independently simulated cases in two additional Chinese cities with distinctly different climatic conditions: Shanghai (31.2◦N, humid subtropical climate) and Beijing (39.9◦N, humid continental climate). For each validation city, ClimateStudio simulations were performed for fifty randomly selected PVSD configurations across representative hourly timesteps spanning all seasons, generating 5000 independent validation cases per city. These simulations used local TMY weather data with city-specific solar geometries and radiation patterns that differ from the training data. The maximum solar altitude in Beijing (73.5◦) is notably lower than Shenzhen (85.1◦), while Shanghai exhibits intermediate values (82.3◦). Direct normal irradiance patterns also differ significantly, with Beijing experiencing higher peak values but fewer annual sunshine hours compared to the humid southern cities.
Fig. 5 presents scatter plots comparing model predictions against ClimateStudio simulation results for the two validation climates. The cross-climate validation demonstrates strong generalization capability with modest performance degradation compared to the Shenzhen test set, reflecting the challenge of generalizing to unseen solar geometry ranges and radiation patterns. Shanghai achieved of 0.977 for sUDI and for sDGP , while Beijing achieved R² of 0.963 for sUDI and R² of 0.955 for sDGP . The greater performance degradation for Beijing can be attributed to its more distinct solar geometry, with winter solar altitudes frequently below falling outside the training data range.
Our analysis reveals that prediction errors exhibit heteroscedasticity correlated with the metric values, with smaller variance observed near the boundary values and larger variance in the mid-range. This pattern reflects the physical constraints at extreme conditions where daylight performance is more predictable. Despite the increased uncertainty in mid-range predictions, errors remain within acceptable bounds (RMSE for practical control applications. The consistently high accuracy across both validation climates confirms that the models have learned transferable physical relationships between solar position, shading configuration, and indoor daylight metrics rather than memorizing Shenzhen-specific patterns. This cross-climate validation provides confidence that the surrogate models can be deployed in diverse geographic locations, though retraining with local data would further improve performance for applications requiring the highest accuracy.
As an additional validation of the surrogate model beyond crossclimate generalization, Sobol sensitivity analysis was also indepen dently conducted on the Random Forest model outputs and compared against the ClimateStudio-based sensitivity results. The consistency between both sets of indices confirms that the surrogate model has faithfully reproduced the underlying physical input-output relationships of the daylight system. The detailed comparison is presented in pendix IV.
3.5. Control strategy
3.5.1. Global optimization algorithm
Particle Swarm Optimization (PSO) was selected for real-time shading optimization based on computational efficiency, gradient-free operation, multi-modal search capability, and simple parameterization. Preliminary testing across one hundred conditions showed PSO (10 particles, 10 iterations) required 0.24 s versus 0.38 s for Genetic Algorithm and 0.42 s for Differential Evolution, a 37% speed advantage critical for real-time control.
PSO maintains a swarm of particles, each with position angle] velocity , personal bes , and global best Particles move according to:
where (inertia), (cognitive/social coefficients), and (random numbers). These follow standard recommendations and were validated through sensitivity analysis.
The fitness function integrates four normalized objectives:
where each term is normalized to the range [0,1] to ensure equal weighting scales:
The maximum values used for normalization are determined from the training dataset and theoretical limits: representing the theoretical maximum achievable with optimized shading under favorable conditions, sDGP_max = 1.0 representing complete absence of glare across all view positions, representing a fully open window with no view obstruction, and calculated from Eq. (3) assuming optimal sun tracking with panel normal vector aligned with solar vector and maximum available irradiance.
The weight vector w₄] satisfies the normalization constraint , enabling interpretation of weights as priority allocation percentages. For example, weights of indicate equal priority for illuminance quality and glare protection while ignoring view and generation. Section 3.5.3 defines specific weight combinations corresponding to different operational strategies including daylighting-priority, integrated optimization, and electricitypriority modes. The hyperparameter optimization and tuning of the PSO optimization algorithm is detailed in Appendix III.
It is important to distinguish between sensitivity-derived feature importance and user-specified optimization weights. The Sobol sensitivity analysis described in Appendix II informed feature selection for the surrogate models by identifying which input parameters significantly influence daylight metrics. In contrast, the weights through in the fitness function are policy parameters that allow building operators to express preferences among competing objectives according to operational requirements. These weights do not derive from sensitivity analysis but rather represent deliberate prioritization decisions. For example, a medical facility requiring strict glare control might assign for sDGP, while a net-zero energy building might prioritize 0.4 for photovoltaic generation.
3.5.2. Reactive optimal control framework
In this study, Reactive Optimal Control (ROC) was implemented as the core control methodology for real-time PVSD optimization. Unlike conventional Model Predictive Control (MPC) that employs multi-step prediction horizons to anticipate future states [79], ROC optimizes control actions based on current environmental conditions at each timestep. This approach is justified by the specific characteristics of PVSD systems where configuration changes are instantaneous and optimal shading depends primarily on current solar geometry rather than accumulated thermal states.
3.5.2.1. ROC implementation and framework. Fig. 6 illustrates the complete research workflow integrating the four optimization objectives, data-driven model development, multi-objective weighting, and real-time optimization process. The workflow diagram is organized into five sequential phases that transform raw objectives into optimal shading configurations.
As shown Fig. 6, Phase 1 (Optimization Objective Selecting) iden tifies the four sub-objectives: illuminance (sUDI), glare guard (sDGP), vision level (OF), and photovoltaic power (PPG). Phase 2 shows parallel development paths where sUDI and sDGP are predicted through dataset collection from ClimateStudio followed by machine learning model training in Python, while OF is calculated through vision database building in Ladybug and PVG is computed through sky model building leading to equivalent circuit model calculations based on single-diode modeling (SDM). Phase 3 (Parameter Weighting) demonstrates how users assign priority weights W1 through W4 to each objective, enabling user-adaptive control strategies. Phase 4 (Fitness Calculation) shows the PSO optimization method receiving these weighted objectives, with the fitness function mathematically expressed as f(x) = W1×sUDI + W2×sDGP + W3×OF + W4×PPG, followed by Euclidean distance calculation to evaluate configuration proximity to the optimal solution. Phase 5 (Shading Form Schedule Output) produces the final ideal shading form as a time-series schedule of position and angle configurations. The figure emphasizes the critical integration point where machine learning predictions (8 ms inference time) enable real-time PSO optimization (240 ms total) within the hourly control cycle, a computational breakthrough that distinguishes this approach from simulationbased methods requiring 15 min or more per evaluation. The bidirectional arrow between Phase 4 and Phase 5 indicates the iterative nature of the optimization process, where PSO continuously evaluates and refines candidate solutions until convergence criteria are met as demonstrated in Fig. 7.
At each hourly timestep, the ROC algorithm executes the following sequence. First, state observation acquires current environmental conditions including solar altitude angle, solar azimuth angle, and direct normal irradiance from weather stations or sensor measurements. Second, performance prediction evaluates candidate configurations by predicting sUDI and sDGP using trained Random Forest models (8 ms per prediction), calculating OF using geometric raytracing, and calculating PVG using the photovoltaic model incorporating the Perez sky model and self-shading calculations. Third, multi-objective optimization executes PSO to find configuration x maximizing the weighted objective f(x) subject to geometric constraints. Fourth, control implementation commands PVSD actuators to the optimal configuration. Fifth, time advancement increments by one hour and returns to step one, creating a receding-horizon control loop.*
The reactive approach differs from conventional MPC in several important aspects. First, ROC uses single-step optimization based on current conditions rather than multi-step prediction horizons. Second, ROC responds to measured environmental states rather than forecasted future conditions. Third, ROC does not explicitly model uncertainty in predictions or forecasts. These simplifications are appropriate for PVSD control because configuration changes are instantaneous (mechanical response under one minute), optimal shading exhibits Markov proper ties where current conditions determine optimal configuration without dependence on past states, and the smooth objective landscape provides implicit robustness to measurement errors.

Fig. 6. ROC implementation framework in this research.

a) Fitness

b) Fitness contribution degree
Fig. 7. The influence of iterations on fitness optimization and contribution value
3.5.3. Rule based control method
The study compared the daylighting, field of view and energy results under four working conditions under the climatic conditions of Shenzhen. All simulations and calculations were based on TMY data. The various working conditions are shown in the Table 6 as follows. Due to the highest contribution of the south-facing facade to the indoor thermal environment, this study only analyzed the south-facing PVSD.
Furthermore, in order to enhance the robustness of the existing dy namic shading control system, ROC can be combined with the optimized generation strategy, and the RBC (Rule Control) strategy can be intro duced in specific scenarios to enhance the adaptability of the system. The following are some of the preset RBC control logics:
-
When there is no natural light or the direct solar radiation is too low, the shading device should be folded to the upper part (A = 90, P=−0.14) to enhance ventilation, visibility, or lighting effects.
-
In the power generation priority mode, a decentralized shading layout (P = 0) is adopted to reduce mutual shading and optimize the Angle between the photovoltaic panels and the solar vector to maximize the photovoltaic power generation.
-
Through the user-preset form, it supports quick manual adjustment of shading, such as fully folding to the top (A = 0, P = 0.14), fully folding to the bottom (A = 90, P=−0.14), evenly distributed (A = 90, P = 0), blocking the upper part of the window (A = 45, P=−0.07), and blocking the lower part of the window (A = 45). P = 0.07), overall upper occlusion (A = 45, P = 0), etc.
Table 6
Shading control mode based on different control objectives.
In the future, with the application of control strategies, the recog nition of shading scenes can be further optimized through user feedback, and the RBC strategy and preset forms can be expanded to enhance the intelligence and user experience of the system.
4. Results and analysis
4.1. Comparative analysis of ROC methods
Three baseline control strategies were implemented for validation. Rule-Based Control (RBC) uses fixed DNI thresholds to set louver con figurations based on solar intensity and altitude. Sensor-Based Control (SBC) employs an illuminance sensor at room center with reactive feedback to adjust louver angles. Optimized Schedule Control (OSC) uses precomputed optimal configurations for each hour of the typical meteorological year based on clear sky solar position without adaptation to actual weather conditions. Table 7 compares annual performance across all control strategies evaluated for the Shenzhen climate using TMY data, demonstrating substantial advantages of ROC over conven tional approaches.
ROC-IO achieves 24% net energy savings compared to OSC, reducing annual consumption from 680 to 1050 kWh. This improvement combines superior performance across all objectives against OSC: sUDI increases 20% to 0.67, sDGP improves 14% to 0.95 representing near complete glare elimination, OF increases 15% to 0.70, and PVG increases 9% to 850 kWh. The cloudy day performance metric reveals superior robustness, exhibiting only 2% performance degradation under variable weather compared to 22% degradation for OSC.
Rule-Based Control limitations include fixed thresholds unable to adapt to seasonal variations, binary decisions between configurations that miss optimization opportunities, and single objective focus priori tizing thermal comfort while ignoring daylighting quality and PV generation. Sensor-Based Control suffers from reactive rather than anticipatory control where louvers close after glare occurs, single sensor representation that cannot capture spatial heterogeneity, and absence of PV generation consideration. Optimized Schedule Control achieves good performance under clear sky conditions but exhibits 22% performance degradation on cloudy days when precomputed schedules become suboptimal. While ROC shares the reactive characteristic with SBC in that it responds to current rather than forecasted conditions, ROC achieves good performance through multi-objective optimization across the full configuration space rather than simple threshold-based responses. Moreover, the 240 ms computational requirement for ROC is readily accommodated by modern building controllers. The energy savings of approximately 160 kWh per year per window provides economic payback for additional computational hardware in under one year while delivering superior occupant comfort through improved daylighting and glare control.
Table 7
Control strategy performance comparison.
4.2. Daylighting performance
4.2.1. Indoor daylighting and glare protection
The spatial Useful Daylight Illuminance (sUDI) and Spatial Daylight Glare Probability (sDGP) analysis reveal significant improvements in indoor lighting quality through dynamic PVSD systems. Fig. 8 presents throughout the year representative day sUDI and sDGP performance across the four control strategies.
Without shading, annual average daily sUDI in Shenzhen reache only 0.23, indicating merely 23% of spatial illuminance falls within the effective range of 200 to 800 lx throughout the day. Winter months exhibit significantly lower performance with sUDI of 0.15 in January due to lower solar altitude angles that create high contrast ratios and limited useful daylight distribution. Summer months show improvement but remain suboptimal at 0.4 to 0.5. Fixed photovoltaic louver shading demonstrates substantial improvements with average daily sUDI reaching 0.54, representing a 135% increase over unshaded conditions. The enhancement is most pronounced in autumn and winter months, exceeding 100% improvement. The most dramatic improvement occurs in February where sUDI rises from 0.12 to 0.52, a 333% increase. Dynamic photovoltaic louver shading achieves further refinement through real time geometric optimization. During October to February, dynamic control increases effective daylight space by an additional 20% to 60% compared to fixed shading through adjusting both louver angle and vertical position in response to changing solar angles. Summer performance converges with fixed shading results, suggesting optimal configuration remains relatively stable during high solar altitude periods. The daylighting priority strategy consistently delivers superior indoor light environment quality with average daily sUDI generally above 0.6 and peak values reaching 0.79. This represents improvements of 81%, 15%, and negligible change compared to no shading, fixed shading, and integrated optimization strategies, respectively.
Glare control represents a critical challenge in subtropical climates with high solar radiation intensity. The sDGP analysis focuses on the near window area within 3.6 m of the facade. Fig. 8b illustrates representative daily average sDGP performance across different shading strategies. Without shading protection, sDGP performance exhibits concerning results throughout the year. Winter months show particularly poor performance with values below 0.5, indicating more than 50% of the near-window area experiences disturbing or intolerable glare. This winter glare problem results from low solar angles that create direct view of the sun disk and bright sky regions from typical seated viewing positions. Fixed photovoltaic louver shading dramatically improves glare control performance with sDGP increasing to over 0.7 across all seasons and peak performance reaching 0.93 in July. This improvement demonstrates that even static louver configurations can effectively block direct solar penetration and reduce luminance contrasts. The consistent performance throughout the year suggests geometric configuration plays a more critical role than dynamic adjustment for this metric. The forms of no shading and fixed shading are shown in Fig. 9a, while the form of PVSD throughout Jan 20th is shown in Fig. 9b Dynamic photovoltaic shading louvers show significant performance improvements in glare control. While summer performance matches fixed shading, winter months show additional improvements of approximately 10% through the ability to track low solar angles and adjust louver positions to block direct sun penetration while maintaining useful daylight levels.
The daylighting priority strategy achieves the most stable and comprehensive glare protection, maintaining overall average daily sDGP at approximately 0.95. This consistency across seasons and times demonstrates the effectiveness of predictive control in anticipating and preventing glare conditions before they occur, successfully creating a visual environment characterized by both appropriate illuminance levels and minimal glare probability.

(a) sUDI level

(b) sDGP level
Fig. 8. Daylighting and glare level on representative day in each month with different control modes.
4.2.2. Vision level
The Openness Factor analysis reveals complex trade-offs between environmental control and visual connectivity in dynamic shading systems. Fig. 10 presents annual distribution of vision levels achieved under different control strategies.
The daylighting priority strategy demonstrates measurable impacts on visual connectivity with only 50% of annual occupied hours achieving OF above 0.5 and approximately 20% of time periods reaching values above 0.8. The annual average of 0.45 reflects prioritization of lighting quality overview preservation. In contrast, the integrated optimization strategy successfully balances visual connectivity with environmental performance. This strategy maintains OF values above 0.9 for 30% of annual occupied hours while keeping OF above 0.5 for more than 50% of the time. The annual average of 0.7 exceeds that of fixed shading, demonstrating that dynamic control can enhance rather than compromise view quality when properly optimized. The superior view performance is achieved through high degrees of freedom enabling configurations that selectively block high-glare sky regions while
preserving views at eye level.
Temporal analysis reveals strategic adaptations to daily and seasonal variations. Morning and late afternoon periods typically show higher OF values as the control system opens louvers to admit low-angle sunlight while maintaining glare control. Midday periods show reduced OF as the system prioritizes thermal and glare protection while maintaining minimum thresholds to ensure psychological connection to outdoors.
4.3. Energy performance
4.3.1. Cooling load
The impact of dynamic PVSD systems on cooling load demonstrates substantial savings potential in subtropical climates. Fig. 11 illustrates monthly and hourly cooling load reductions achieved through different shading strategies.
As indicated in Fig. 11a, fixed photovoltaic shading reduces annual cooling load by 8.3% primarily through reduction of direct solar heat gain. The cooling load reduction shows strong seasonal variation with

Room without shading(NS)

Room with fixed shading(FS)
a) diagram of the shading system under NS and FS mode

b) PVSD form change during a representative day
Fig. 9. Scenarios of no shading (NS), fixed shading (FS), and dynamic PVSD system on Jan 20th.

Fig. 10. Annual distribution of vision levels achieved under different control strategies.
summer months achieving 12% to 15% reductions while winter improvements remain minimal. Dynamic PVSD systems achieve significantly higher cooling energy reductions through adaptive response to solar conditions. The integrated optimization strategy reduces annual cooling demand by 12.6%, representing a 52% improvement over fixed shading. The enhanced performance results from continuous optimization to minimize solar heat gain while maintaining daylight targets. Peak summer reductions reach 18% to 20%.

a) Monthly cooling load demand (kWh)

b) Hourly cooling load demand (kWh) on representative day for each month
Fig. 11. Cooling load demand (kWh) under different control modes.
Hour by hour analysis of representative day for each month shown in Fig. 11b reveals sophisticated response to diurnal patterns. During morning hours, the system maintains relatively open configurations to admit beneficial daylight while cooling load remains low. As solar intensity increases, the control algorithm progressively adjusts louver angles and positions to track the solar path. This adaptive behavior is particularly effective during partly cloudy conditions where the system can rapidly respond to changing irradiance levels.
4.3.2. Artificial lighting energy saving
The evaluation of lighting energy performance required development of an equivalent time method due to limitations in simulating illuminance-based lighting control across the distributed spatial grid. Fig. 12a illustrates the illuminance sampling point positioned 0.8 m above floor level at room center, serving as the lighting control sensor, while Fig. 12b presents illuminance levels at the sampling point throughout representative days for each month, revealing dramatic impact of shading strategy on daylight availability at room center.
Without shading, the sampling point experiences extreme illuminance variability with peak values reaching 1400 to 1800 lx during midday summer periods, dropping to 300 to 600 lx in winter. This high spatial variability triggers electric lighting in most part of the space even when window zones are over-lit. Fixed photovoltaic shading dramati cally improves illuminance temporal stability at room center, main taining sampling point illuminance within 200 to 800 lx for substantially longer periods than unshaded conditions. The diffusion and reflection effects of horizontal louvers redirect incident light toward ceiling and deeper zones rather than concentrating it near the window.
Dynamic photovoltaic shading systems achieve superior illuminance distribution through adaptive geometric optimization. Winter months show particularly dramatic improvements with the system maintaining 600 to 800 lx at room center during midday periods where unshaded conditions achieved only 300 to 500 lx and fixed shading achieved 450 to 600 lx. This enhanced penetration results from adjusting louver angles and positions to redirect low-angle winter sun deeper into the space. Fig. 13 quantifies the lighting energy implications through annual energy consumption analysis across all control strategies.
Without shading, baseline annual lighting energy consumption reaches 538.4 kWh. Fixed photovoltaic shading reduces annual lighting energy to 468 kWh, a 13% reduction, by improving daylight distribution uniformity. The dynamic PVSD systems achieve the greatest lighting energy reductions through optimized daylight delivery. The daylighting priority strategy reduces annual lighting energy by 118 kWh to 420 kWh through maximization of useful daylight hours. The integrated optimi zation strategy achieves 88 kWh annual lighting savings to 450 kWh, slightly less than daylighting priority as the balanced weighting results in occasional compromises on daylighting quality to favor other objectives.

a) Illuminance level sampling point in the space

b) Hourly illuminance level on representative day for each month
Fig. 12. Illuminance level comparison under various control modes.
4.3.3. Photovoltaic generation and net energy use
The photovoltaic generation analysis reveals complex interplay between shading performance and energy production in integrated PVSD systems. Fig. 14a presents monthly generation profiles under different control strategies. To evaluate net energy use that can demonstrate the renewable integration of the proposed PVSD systems, Fig. 14b synthesizes cooling, heating, lighting demands and photovoltaic generation to reveal overall energy performance of the space.
A notable seasonal crossover pattern emerges in Fig. 14a: the fixed system (FPS) outperforms all dynamic strategies during summer months (April–August), peaking at approximately 81 kWh in August, likely because its fixed tilt angle is inherently well-aligned with high summer solar angles. Conversely, during winter months (November–February), FPS generates considerably less — dropping to around 40–43 kWh in November and December, while dynamic systems maintain comparatively stable output of 60–66 kWh, suggesting their adaptive positioning better captures lower-angle winter solar radiation. Among dynamic strategies, DPS-EP consistently produces the highest monthly generation across nearly all months, as expected given its energy-production oriented objective. DPS-DL and DPS-IO perform similarly throughout the year, with only marginal differences. Annually, the dynamic systems appear to compensate for their summer underperformance through superior winter generation, resulting in broadly comparable or modestly higher total annual PV output relative to FPS.
Fig. 14b shows that the fixed PVSD system (FPS) can reduce net energy consumption by approximately 41%, bringing annual consumption from roughly 2200 kWh (NS baseline) down to approximately 1300 kWh. This reduction combines multiple mechanisms including direct cooling load reduction through shading, lighting energy savings through improved daylight distribution, and offset through photovoltaic generation. Dynamic PVSD systems with optimized control achieve greater net energy reductions of approximately 52%, reducing annual consumption to approximately 1050 kWh (DPS-IO). This performance moves the conditioned space meaningfully toward net zero energy targets. The roughly 19% improvement over the fixed system results from cumulative benefits of optimized thermal protection, enhanced daylight utilization, and maximized generation achieved through intelligent realtime control. The daylighting priority strategy (DPS-DL) achieves approximately 1100 kWh, while the energy production priority strategy (DPS-EP) achieves approximately 1150 kWh, generating maximum electricity but accompanied by comparatively higher cooling loads.

Fig. 13. Annual lighting energy conservation.

a) Monthly photovoltaic power generation

b) Annual net energy use
Fig. 14. Photovoltaic power generation and space net energy use.
Sensitivity analysis reveals that control strategy selection can impact net energy consumption by up to 10%, emphasizing the importance of user-adaptive optimization matched to building priorities. For applications prioritizing absolute energy minimization, integrated optimization provides optimal performance. For applications priori tizing occupant experience, the daylighting priority provides superior environmental quality at a modest energy penalty. The ability to adjust objective weightings enables a single hardware system to serve diverse applications by reconfiguring control priorities through software. The approximately 1050 kWh annual net consumption for integrated opti mization represents roughly 48% of the baseline 2200 kWh, represent ing a substantial improvement over the unshaded case. The remaining energy gap could be closed through additional strategies including improved envelope insulation performance, high-efficiency HVAC equipment, or expanded PV deployment on other building surfaces.
Table 8
5. Discussion
This study presents a comprehensive framework for high-degree-offreedom photovoltaic shading devices integrated with data-driven reactive control, achieving unprecedented performance in balancing competing building objectives. The results demonstrate substantial advancements across all metrics: 52% net energy reduction, sUDI improvement from 0.23 to 0.79, near-complete glare elimination (sDGP=0.95), and 850 kWh annual generation. These outcomes validate the hypothesis that sufficient geometric flexibility combined with intelligent control can approach optimal solutions across multiple ob jectives simultaneously.
5.1. Technical innovations and performance implications
The many possible configurations of the proposed PVSD system represent a paradigm shift from conventional shading systems that typically offer fewer than 10 discrete states. This enhanced geometric flexibility translates directly into measurable performance improvements: 52% reduction in net energy consumption compared to 41% for fixed systems, and the ability to maintain sUDI above 0.6 for 79% of occupied hours. The dense configuration space enables optimal solutions that minimize trade-offs, as evidenced by the integrated optimi zation strategy achieving 92% of maximum PV generation while maintaining superior daylight and glare metrics. To evaluate the advancement of the proposed approach, Table 8 compares key performance metrics with representative PVSD control studies from literature.
The comparison reveals several key advantages of our approach. First, the 255 effective configurations substantially exceed conventional systems while remaining computationally tractable, enabling finegrained optimization across the feasible design space. The Random Forest surrogate models achieve high prediction accuracy exceeding that reported in comparable data-driven studies, attributable to the comprehensive training dataset of 1126,335 samples and the stratified validation approach. Moreover, the millisecond-level inference time enables real-time optimization that is three to four orders of magnitude faster than simulation-based approaches, making hourly control updates practically feasible. The demonstrated weather robustness with only 2% performance degradation under variable conditions represents a critical advantage for deployment in climates with frequent weather variability.
The development of data-driven models for sUDI and sDGP predic tion represents a crucial enabler for real-time optimization. Traditional daylight simulation requires minutes to hours for accurate analysis, while our machine learning approach, achieving of 0.984, reduces prediction time to milliseconds. This computational efficiency enables the ROC system to evaluate hundreds of potential configurations within each control timestep. By predicting spatial distributions rather than point measurements, our system identifies configurations that provide uniform conditions throughout the occupied space, addressing a critical limitation of sensor-based control strategies.
The choice to focus on near-window area sDGP for model training addresses both statistical and practical challenges. As shown in Table 4, the whole-space sDGP exhibits right-skewed distribution unsuitable for machine learning, while near-window metrics show better statistical properties. This approach ensures control decisions address the most problematic glare areas while achieving robust model performance, providing a methodological contribution applicable to other building control applications where spatial heterogeneity creates modeling challenges.
5.2. Climate adaptation and comparative advantages
The Shenzhen case study reveals important considerations for subtropical PVSD deployment. Minimal heating requirements (negligible as shown in Fig. 14b) eliminate winter solar gain considerations that complicate control in temperate climates, allowing year-round prioritization of cooling reduction and glare control. This explains why dynamic systems achieve relatively modest summer improvements over fixed shading (18% versus 12% cooling reduction). The fixed horizontal configuration can be optimized specifically for cooling season without winter penalties. However, the high cooling demands and intense solar radiation create ideal conditions for PVSD technology, with 850 kWh annual generation representing approximately 41% of total energy consumption, demonstrating natural synergies between peak cooling demands and peak solar availability.
Compared to baseline control strategies evaluated in Table 7, ROC-IO achieves 24% energy savings beyond the best alternative while demonstrating superior robustness with only 2% cloudy-day degradation versus 22% for schedule-based control. This 10-fold improvement in weather adaptability validates the value of real-time optimization versus predetermined strategies. The comparison reveals critical limitations of conventional approaches: RBC achieves only 69.6% of ROC's savings due to fixed thresholds unable to adapt seasonally; SBC produces the worst daylighting (sUDI=0.38) from reactive over-shading; and OSC, while performing well under typical conditions (82% of ROC performance), exhibits 22% degradation during atypical weather when pre-computed schedules become suboptimal.
The integrated optimization strategy's ability to achieve nearmaximum PV generation (96% of theoretical) while maintaining superior comfort metrics reveals fundamental compatibility between objectives during peak periods. Geometric analysis shows that summer midday optimal shading angles (60–75◦ for sDGP>0.90) differ only 10–15◦ from optimal generation angles (75–85◦ perpendicular to sun), creating minimal generation penalty. This compatibility explains why DPS-IO allocating only 25% weighting to generation achieves 96% of
Comparison of proposed ROC framework with existing PVSD control approaches.
DPS-EP's maximum since the objectives naturally align during the 35% of daily generation occurring at midday. However, optimized PVSDs frequently adopt closed configurations under high solar angles due to self-shading effects (15–25% losses during low altitude periods). While increased panel spacing could reduce mutual shading, it would decrease total PV area proportionally, revealing a fundamental trade-off between coverage and efficiency inherent in multi-element systems.
The robustness to weather variability deserves particular attention for Shenzhen's subtropical monsoon climate, which experiences frequent cloudy and partly cloudy conditions especially during the monsoon season from April through September. Under the cloudiness conditions of TMY, the ROC-IO strategy maintains consistent perfor mance because it responds to actual measured irradiance rather than assuming typical clear-sky patterns. Table 7 quantifies this advantage: ROC-IO exhibits only 2% performance degradation on cloudy days compared to clear days, while Optimized Schedule Control degrades by 22% because pre-computed schedules assume solar availability that does not materialize. The practical implication is that building operators can deploy the ROC system with confidence that performance will remain stable across the full range of weather conditions encountered in subtropical climates.
5.3. Limitations and future directions
First, the single-zone model could simplify real building complexity. Multi-zone buildings with varying orientations and occupancy patterns require extended control frameworks with hierarchical architectures coordinating between spaces. The reliance on TMY weather data may not capture extreme events becoming more frequent with climate change, suggesting need for robust control strategies explicitly consid ering prediction uncertainty. The study demonstrates uncertainty quantification which ROC incorporates through increased penalty weighting when σ>0.05, but more sophisticated stochastic optimization methods could further enhance robustness.
A notable limitation of this study is the absence of physical validation against field measurements. Our simulation approach relies on the established accuracy of ClimateStudio and EnergyPlus, which have been validated extensively in prior research, rather than site-specific calibration. The Ideal Loads Air System with adiabatic boundaries further simplifies the thermal model. While these approaches are appropriate for proof-of-concept studies comparing control strategies, future implementation in actual buildings should incorporate commissioning measures to calibrate models for specific facade orientations, glazing properties, and HVAC system characteristics. Validation protocols following ASHRAE Guideline 14 for energy models or IES LM-83 for daylight models would strengthen confidence in absolute performance predictions. Nevertheless, the relative performance improvements demonstrated between control strategies are expected to persist across calibrated models, as these improvements stem from fundamental physical principles governing solar geometry and daylight distribution.
User preference analysis reveals that weighting allocation can shif annual consumption by 10%, highlighting the importance of adaptive, user-centric control beyond the fixed strategies evaluated. Future work should explore hybrid strategies incorporating user feedback through reinforcement learning, enabling automatic adaptation to implicit preferences revealed through manual override patterns. Variablespacing PVSD designs optimizing the coverage-efficiency trade-off merit investigation—preliminary analysis suggests removing every other louver with 0.30 m spacing could reduce self-shading losses from 15% to 5% but would halve PV area, requiring optimization of this discrete design parameter alongside continuous control variables. Moreover, we believe that integration with weather forecasting could enable anticipatory control extending beyond the single-step horizon currently implemented. Multi-step ROC would allow predictive strategies such as pre-cooling during low-solar morning hours in anticipation of afternoon heat, potentially reducing peak loads 8–12% based on preliminary simulation. However, forecast uncertainty beyond 6–12 h limits practical horizon length, and computational requirements scale linearly with horizon (e.g., 24-step would require 5.76 s versus current 0.24 s), necessitating careful cost-benefit analysis.
The successful demonstration in a subtropical climate suggests potential for global deployment with climate-specific tuning. Temperate climates requiring heating would benefit from seasonal strategy switching, such as maximizing solar gain in winter while maximizing shading in summer, while arid climates with extreme solar radiation could achieve even greater cooling reductions. Urban-scale deployment transforming facades into active energy infrastructure could contribute to grid stability through distributed generation and demand response, though this requires investigation of aggregation control strategies coordinating hundreds of buildings. Further investigation on the system economics of the proposed system, including various power generation and energy management scenarios, will be of interest to be conducted in the future.
When it comes to practical application, for multi-window scalability, the ROC framework can be extended through hierarchical control architectures where individual window controllers optimize local objectives while a supervisory layer coordinates facade-level performance. The computational efficiency of our approach supports this scalability, as a typical floor with twenty windows could be optimized within 5 s using parallel processing. Regarding Building Management Systems (BMS) integration, the framework outputs standard control signals (position and angle setpoints) compatible with conventional building automation protocols such as BACnet or Modbus. The trained surrogate models require minimal computational resources (45 MB memory) suitable for edge deployment on standard building controllers. In addition, lifecycle assessment and prototype testing are valuable directions for future research. LCA would quantify embodied carbon of PVSD components against operational energy savings, while physical prototypes would validate the mechanical reliability of the high-DOF actuation system under real-world conditions.
6. Conclusion
This study successfully developed and validated a transformative approach to building envelope design through high-degree-of-freedom photovoltaic shading devices with intelligent data-driven control. The proposed system addresses critical limitations in existing PVSD technology by integrating mechanical innovation with 255 feasible configurations through combined ±0.14 m translation and 0–90◦ rotation after collision exclusion, advanced modeling (Random Forest achieving R²=0.984 with 8 ms inference), and real-time optimization (ROC with PSO balancing four competing objectives). Comprehensive evaluation in Shenzhen's subtropical climate demonstrated exceptional performance improvements validating the hypothesis that sufficient geometric flexibility combined with intelligent control can approach Pareto-optimal solutions.
The key innovations and findings of this research include:
• Daylighting quality transformation: sUDI increased from 0.23 (un shaded) to 0.79 (DPS-DL), representing 243% improvement, with near-complete glare elimination (sDGP=0.95) achieved across all seasons. The system maintained useful daylight for 79% of occupied hours compared to 23% baseline, while preserving visual connectivity (OF=0.70 for integrated optimization).
• Energy performance breakthrough: Net energy consumption reduced 52% from 2200 to 1050 kWh annually, substantially exceeding fixed shading (41% reduction). This combines 12.6% cooling load reduction, 22% lighting energy savings, and 850 kWh annual PV generation—approaching net-zero performance for the test space.
• Multi-objective optimization success: The integrated strategy (DPS-IO) achieved 92% of maximum PV generation (780 kWh versus 850 kWh theoretical) while simultaneously delivering superior daylighting (sUDI=0.67) and glare control (sDGP=0.95), demonstrating that adequate geometric freedom minimizes traditional trade-offs between competing objectives.
• Computational efficiency enabling real-time control: Significantly reduced performance prediction by machine learning surrogate models enables rapid PSO optimization, which is suitable for hourly ROC updates. The observed speedup distinguished the approach from simulation-based methods, achieving 24% energy savings beyond the best baseline strategy.
Future research directions should address the identified limitations and explore broader applications. Extension to multi-zone buildings requires hierarchical control architectures that coordinate between spaces with varying requirements. Integration with weather forecasting services could enable anticipatory control strategies that prepare for incoming conditions. Investigation of variable-spacing louver designs may better optimize the trade-off between mutual shading and generation capacity identified in our analysis. This work represents a signifi cant step toward truly responsive architecture where building envelopes dynamically mediate between interior requirements and exterior conditions while generating renewable energy. The convergence of advanced materials, intelligent control, and data-driven optimization demonstrated in this study opens new possibilities for sustainable building design that enhances rather than compromises between human comfort and environmental performance.
CRediT authorship contribution statement
Hao Zhang: Writing – original draft, Visualization, Validation, Software, Investigation. Zheng Wang: Writing – review & editing, Validation, Project administration, Methodology, Formal analysis. Bicui Ye: Writing – review & editing, Supervision, Methodology, Formal analysis. Yuekuan Zhou: Writing – review & editing, Supervision, Resources, Methodology. Xue Liu: Validation, Resources, Project admin istration, Funding acquisition. Yi Zhang: Supervision, Methodology, Formal analysis, Data curation. Pengyuan Shen: Writing – review & editing, Writing – original draft, Supervision, Project administration, Methodology, Funding acquisition, Conceptualization.
Declaration of competing interest
The authors declare that they have no known competing financial interests or personal relationships that could have appeared to influence the work reported in this paper.
Acknowledgement
This study is supported by Shenzhen Fundamental Research Program (JCYJ20250604180231041) and National Natural Science Foundation of China (No. 52408132).
Supplementary materials
Supplementary material associated with this article can be found, in the online version, at doi:10.1016/j.buildenv.2026.114718.
Data availability
Data will be made available on request.
References
[1] IEA, The Critical Role of Buildings, 2019. https://www.iea.org/reports/the-critica l-role-of-buildings. Paris.
[2] P. Shen, Z. Wang, Y. Ji, Exploring potential for residential energy saving in New York using developed lightweight prototypical building models based on survey data in the past decades, Sustain. Cities. Soc. 66 (2021) 102659.
[3] S.R. Hastings, M. Wall, Building envelope, Sustain. Sol. Hous.: Routledge (2012) 91–137.
[4] P. Shen, Building and urban simulation under future climate: a novel statistical downscaling method for future hourly weather data generation, Build. Simul. 18 (2025) 1611–1639.
[5] M. Krarti, A. Karrech, Evaluation of static and dynamic PV-integrated shading systems for office spaces in Australia, Sol. Energy 277 (2024) 112736.
[6] M. Kent, S. Schiavon, Evaluation of the effect of landscape distance seen in window views on visual satisfaction, Build Env. 183 (2020) 107160
[7] Y. Li, L. Li, P. Shen, Probability-based visual comfort assessment and optimization in national fitness halls under sports behavior uncertainty, Build Env. 242 (2023) 110596.
[8] Nasrollahzadeh Mehrabadi E., Pilehchi Ha P., Mahdavinejad M. Horsefly: a simulation tool to evaluate view to outdoor 2021.
[9] H. Yu, T. Akita, Effects of illuminance and color temperature of a general lighting system on psychophysiology while performing paper and computer tasks, Build Env. 228 (2023) 109796.
[10] S. Grynning, A. Gustavsen, B. Time, B.P. Jelle, Windows in the buildings of tomorrow: energy losers or energy gainers? Energy Build. 61 (2013) 185–192
[11] R. Singh, I.J. Lazarus, V.V.N Kishore, Effect of internal woven roller shade and glazing on the energy and daylighting performances of an office building in the cold climate of Shillong, Appl. Energy 159 (2015) 317–333.
[12] Y. Zheng, J. Wu, H. Zhang, C. Lin, Y. Li, X. Cui, et al., A novel sun-shading design for indoor visual comfort and energy saving in typical office space in Shenzhen, Energy Build. 328 (2025) 115083.
[13] T. Cheng, Y. Tahouni, E.S. Sahin, K. Ulrich, S. Lajewski, C. Bonten, et al., Weatherresponsive adaptive shading through biobased and bioinspired hygromorphic 4Dprinting, Nat. Commun. 15 (2024) 10366.
[14] X. Zhang, S.-K. Lau, S.S.Y. Lau, Y. Zhao, Photovoltaic integrated shading devices (PVSDs): a review, Sol. Energy 170 (2018) 947–968.
[15] X. Chen, Y. Qiu, X. Wang, A systematic review of research methods and economic feasibility of photovoltaic integrated shading device, Energy Build. 311 (2024) 114172.
[16] A. Kirimtat, M.F. Tasgetiren, P. Brida, O. Krejcar, Control of PV integrated shading devices in buildings: a review, Build Env. 214 (2022) 108961.
[17] Y. Ibraheem, P. Piroozfar, E.R.P. Farr, N. Ravenscroft, Energy production analysis of photovoltaic shading devices (PVSD) in integrated façade systems (IFS), Front. Built. Environ. 6 (2020) 2020
[18] A. Mesloub, A. Ghosh, M. Touahmia, G.A. Albaqawy, E. Noaime, B.M. Alsolami Performance analysis of photovoltaic integrated shading devices (PVSDs) and semi transparent photovoltaic (STPV) devices retrofitted to a prototype office building in a hot desert climate, Sustainability. 12 (2020) 10145.
[19] M. Mandalaki, S. Papantoniou, T. Tsoutsos, Assessment of energy production from photovoltaic modules integrated in typical shading devices, Sustain. Cities. Soc. 10 (2014).222-231
[20] W. Bahr, A comprehensive assessment methodology of the building integrated photovoltaic blind system, Energy Build. 82 (2014) 703–708.
[21] M. Mandalaki, T. Tsoutsos, N. Papamanolis, Integrated PV in shading systems for Mediterranean countries: balance between energy production and visual comfort, Energy Build. 77 (2014) 445–456.
[22] A. Saranti, T. Tsoutsos, M. Mandalaki, Sustainable energy planning. Design shading devices with integrated photovoltaic systems for residential housing units, Procedia Eng. 123 (2015) 479–487.
[23] S. Pushkar, Environmental damage and saving benefit of external shading devices via photovoltaic (PV) energy generation, J. Green Build. 11 (2016) 95–109.
[24] J. Hofer, A. Groenewolt, P. Jayathissa, Z. Nagy, A. Schlueter, Parametric analysis and systems design of dynamic photovoltaic shading modules, Energy Sci. Eng. 4 (2016) 134–152.
[25] Z. Nagy, B. Svetozarevic, P. Jayathissa, M. Begle, J. Hofer, G. Lydon, et al., The Adaptive Solar Facade: from concept to prototypes, Front. Archit. Res. 5 (2016) 143–156.
[26] A. Stamatakis, M. Mandalaki, T. Tsoutsos, Multi-criteria analysis for PV integrated in shading devices for Mediterranean region, Energy Build. 117 (2016) 128–137.
[27] P. Chantawong, Experimental study of a PV blinds glazed solar chimney assisted with DC fan for hot water production, Energy Procedia 138 (2017) 20–25.
[28] Taveres-Cachat E., Bøe K., Lobaccaro G., Goia F., Grynning S. Balancing competing parameters in search of optimal configurations for a fix louvre blade system with integrated PV 2017.
[29] X. Li, J. Peng, N. Li, M. Wang, C. Wang, Study on optimum tilt angles of photovoltaic shading systems in different climatic regions of China, Procedia Eng. 205 (2017) 1157 1164.
[30] K. Jeong, T. Hong, C. Koo, J. Oh, M. Lee, J. Kim, A prototype design and development of the Smart photovoltaic system blind considering the photovoltaic panel, tracking system, and monitoring system, Appl. Sci. 7 (2017) 1077.
[31] H.K. Abdullah, H.Z. Alibaba, Retrofits for energy efficient office buildings: integration of optimized photovoltaics in the form of responsive shading devices, Sustainability. 9 (2017) 2096.
[32] Z. Hu, W. He, D. Hu, S. Lv, L. Wang, J. Ji, et al., Design, construction and performance testing of a PV blind-integrated Trombe wall module, Appl. Energy 203 (2017) 643 656.
[33] T. Hong, C. Koo, J. Oh, K. Jeong, Nonlinearity analysis of the shading effect on the technical economic performance of the building-integrated photovoltaic blind, Appl. Energy 194 (2017) 467–480.
[34] C. Koo, T. Hong, K. Jeong, C. Ban, J. Oh, Development of the smart photovoltaic system blind and its impact on net-zero energy solar buildings using technical economic-political analyses, Energy 124 (2017) 382–396.
[35] Y. Luo, L. Zhang, X. Wang, L. Xie, Z. Liu, J. Wu, et al., A comparative study on thermal performance evaluation of a new double skin façade system integrated with photovoltaic blinds, Appl. Energy 199 (2017) 281–293.
[36] P. Jayathissa, J. Zarb, M. Luzzatto, J. Hofer, A. Schlueter, Sensitivity of building properties and use types for the application of adaptive photovoltaic shading systems, Energy Procedia 122 (2017) 139–144.
[37] W. Zhang, L. Lu, J. Peng, Evaluation of potential benefits of solar photovoltaic shadings in Hong Kong, Energy 137 (2017) 1152–1158.
[38] P. Jayathissa, M. Luzzatto, J. Schmidli, J. Hofer, Z. Nagy, A. Schlueter, Optimising building net energy demand with dynamic BIPV shading, Appl. Energy 202 (2017) 726–735.
[39] Y. Luo, L. Zhang, Z. Liu, L. Xie, X. Wang, J. Wu, Experimental study and performance evaluation of a PV-blind embedded double skin façade in winter season, Energy 165 (2018) 326–342.
[40] E. Taveres-Cachat, G. Lobaccaro, F. Goia, G. Chaudhary, A methodology to improve the performance of PV integrated shading devices using multi-objective optimization, Appl. Energy 247 (2019) 731–744.
[41] M.F. Mennatallah, M. Mohamed, A.K. Hamdy, A.S. Lamia, I.M. Elsayed, Simulation of a zero energy office building in Egypt with a photovoltaic integrated shading system, J. Photonics. Energy 9 (2019) 043103.
[42] J.E. Ogbeba, E. Hoskara, The evaluation of single-Family detached housing units in terms of integrated photovoltaic shading devices: the case of Northern Cyprus, Sustainability. 11 (2019) 593.
[43] N. Skandalos, J. Tywoniak, K. Stanˇek, Potential benefits of PV-shading system in office buildings and semi-continental climate conditions, IOP Conf. Ser.: Earth Environ. Sci. 290 (2019) 012085.
[44] M. Akbari Paydar, Optimum design of building integrated PV module as a movable shading device, Sustain. Cities. Soc. 62 (2020) 102368.
[45] N. Skandalos, D. Karamanis, An optimization approach to photovoltaic building integration towards low energy buildings in different climate zones, Appl. Energy 295 (2021) 117017.
[46] J. Liu, G. Bi, G. Gao, L. Zhao, Optimal design method for photovoltaic shading devices (PVSDs) by combining geometric optimization and adaptive control model, J. Build. Eng. 69 (2023) 106101.
[47] Q. Ma, S. Ran, X. Chen, L. Li, W. Gao, X. Wei, Study on the effect of photovoltaic louver shading and lighting control system on building energy consumption and daylighting, Energy Sources A: Recovery Util. Environ. Eff. 45 (2023) 10873–10889.
[48] R. Ito, S. Lee, Performance enhancement of photovoltaic integrated shading devices with flexible solar panel using multi-objective optimization, Appl. Energy 373 (2024) 123866.
[49] K. Zhao, Z. Gou, Optimizing semi-transparent BIPV windows for balanced daylighting and solar energy performance in office buildings, Sol. Energy 287 (2025) 113229.
[50] R. Roshan Kharrat, G. Perfetto, R. Ingaramo, G. Mutani, Optimizing building performance with dynamic photovoltaic shading systems: a comparative analysis of six adaptive designs, Smart Cities 8 (2025) 127.
[51] Z. Luo, C. Sun, Q. Dong, A daylight-linked shading strategy for automated blinds based on model-based control and Radial Basis Function (RBF) optimization, Build Env. 177 (2020) 106854.
[52] X. Ding, A. Cerpa, W. Du, Exploring deep reinforcement learning for holistic smart building control, ACM. Trans. Sens. Netw. 20 (2024) 1–28.
[53] M. Baghoolizadeh, M. Rostamzadeh-Renani, R. Rostamzadeh-Renani, D. Toghraie, Multi-objective optimization of Venetian blinds in office buildings to reduce electricity consumption and improve visual and thermal comfort by NSGA-II, Energy Build. 278 (2023) 112639.
[54] L. Chen, M. Baghoolizadeh, A. Basem, S.H. Ali, B. Ruhani, A.J. Sultan, et al., A comprehensive review of a building-integrated photovoltaic system (BIPV), Int. Commun. Heat Mass Transf. 159 (2024) 108056.
[55] M. Baghoolizadeh, A.A. Nadooshan, S.A.H.H. Dehkordi, M. Rostamzadeh-Renani, R. Rostamzadeh-Renani, M. Afrand, Multi-objective optimization of annua electricity consumption and annual electricity production of a residential building using photovoltaic shadings, Int. J. Energy Res. 46 (2022) 21172–21216.
[56] M. Baghoolizadeh, A.A. Nadooshan, A. Raisi, E.H. Malekshah, The effect of photovoltaic shading with ideal tilt angle on the energy cost optimization of a building model in European cities, Energy Sustain. Dev. 71 (2022) 505–516.
[57] S. Miraba, A. Salehi, M. Rostamzadeh-Renani, R. Ehteshami, A. Shahbazi, R. Rostamzadeh-Renani, et al., Adaptive BIPV shading optimization for electricity
generation and building electricity management, sDA, and DGP using multi objective algorithms, Appl. Energy 402 (2025) 126860.
[58] L. Zhang, Aa Alizadeh, M. Baghoolizadeh, S. Salahshour, E. Ali, J. Escorcia-Gutierrez, Multi-objective optimization of vertical and horizontal solar shading in residential buildings to increase power output while reducing yearly electricit usage, Renew. Sustain. Energy Rev. 215 (2025) 115578.
[59] P. Shen, H. Wang, Archetype building energy modeling approaches and applications: a review, Renew. Sustain. Energy Rev. 199 (2024) 114478.
[60] X. Gao, Y. Ji, P. Shen, A comparative study of radiant floor heating strategies for passive house in severely cold regions: a case study of Harbin, Energy 323 (2025) 135825.
[61] B.V.D. Nguyen, A.V. Moere, The adaptive architectural layout: how the control of a semi-autonomous mobile robotic partition was shared to mediate the environmental demands and resources of an open-plan office, in: Proceedings of the 2024 CHI Conference on Human Factors in Computing Systems, Association for Computing Machinery, Honolulu, HI, USA, 2024 590. Article.
[62] M. Gao, L. Zhao, G. Gao, R. Jin, Z. Nie, A method for achieving optimal therma performance of adaptive opaque facades based on monthly loads across China, J. Build. Eng. 102 (2025) 111813.
[63] A. Nabil, J. Mardaljevic, Useful daylight illuminances: a replacement for daylight factors, Energy Build. 38 (2006) 905–913.
[64] E. Brembilla, J. Mardaljevic, Climate-based daylight modelling for compliance verification: benchmarking multiple state-of-the-art methods, Build Env. 158 (2019) 151–164.
[65] F. Nicoletti, D. Kaliakatsos, M. Parise, Optimizing the control of Venetian blinds with artificial neural networks to achieve energy savings and visual comfort, Energy Build. 294 (2023) 113279.
[66] J. Jakubiec, C. Reinhart, The ‘adaptive zone’ – A concept for assessing discomfort glare throughout daylit spaces, Light. Res. Technol. 44 (2012) 149–170.
[67] P. Petherbridge, R.G. Hopkinson, Discomfort glare and the lighting of buildings, Trans. Illum. Eng. Soc. 15 (1950) 39 79.
[68] T. Hartig, G.W. Evans, L.D. Jamner, D.S. Davis, T. G¨arling, Tracking restoration in natural and urban field settings, J Env. Psychol 23 (2003) 109–123.
[69] F. Beute, Y.A.W. de Kort, Let the sun shine! measuring explicit and implicit preference for environments differing in naturalness, weather type and brightness, J Env. Psychol 36 (2013) 162 178
[70] A. Jamrozik, N. Clements, S.S. Hasan, J. Zhao, R. Zhang, C. Campanella, et al. Access to daylight and view in an office improves cognitive performance and satisfaction and reduces eyestrain: a controlled crossover study, Build Env. 165 (2019) 106379.
[71] W.H. Ko, S. Schiavon, H. Zhang, L.T. Graham, G. Brager, I. Mauss, et al., The impact of a view from a window on thermal comfort, emotion, and cognitive performance, Build Env. 175 (2020) 106779.
[72] A.R. Jordehi, Parameter estimation of solar photovoltaic (PV) cells: a review, Renew. Sustain. Energy Rev. 61 (2016) 354 371.
[73] R.C.M. Gomes, M.A. Vitorino, MBdR Corrˆea, D.A. Fernandes, R. Wang, Shuffled complex evolution on photovoltaic parameter extraction: a comparative analysis, IEEe Trans. Sustain. Energy 8 (2017) 805–815.
[74] O. Mares, M. Paulescu, V. Badescu, A simple but accurate procedure for solving the five-parameter model, Energy Convers. Manage 105 (2015) 139 148.
[75] R. Perez, R. Seals, J. Michalsky, All-weather model for sky luminance distribution—Preliminary configuration and validation, Sol. Energy 50 (1993) 235–245.
[76] A. Saltelli, P. Annoni, I. Azzini, F. Campolongo, M. Ratto, S. Tarantola, Variance based sensitivity analysis of model output. Design and estimator for the tota sensitivity index, Comput. Phys. Commun. 181 (2010) 259–270
[77] B. Iooss, P. Lemaître, A review on Global sensitivity analysis methods, in: G. Dellino, C. Meloni (Eds.), Uncertainty Management in Simulation-Optimization of Complex Systems: Algorithms and Applications, Springer US, Boston, MA, 2015, pp. 101–122.
[78] Z. Pang, Z. O'Neill, Y. Li, F. Niu, The role of sensitivity analysis in the building performance analysis: a critical review, Energy Build. 209 (2020) 109659.
[79] X. Li, J. Wen, Review of building energy modeling for control and operation, Renew. Sustain. Energy Rev. 37 (2014) 517–537.
[80] A. Saltelli, Making best use of model evaluations to compute sensitivity indices, Comput. Phys. Commun. 145 (2002) 280–297.
Fig. 1. The proposed PVSD system in this study.
Publication Details
Journal
Building and Environment
Publication Year
2026
Authors
Hao Zhang, Zheng Wang, Bicui Ye, Yuekuan Zhou, Xue Liu, Yi Zhang, Pengyuan Shen
Categories
Synergizing comfort and energy efficiency in the built environment