
Space layout automation and optimization for energy-efficient buildings: A multi-objective evolutionary approach with machine learning analytics
Peiying Huang, Xing Zheng, Yi Zhang, Pengyuan Shen
2026
Energy and Buildings
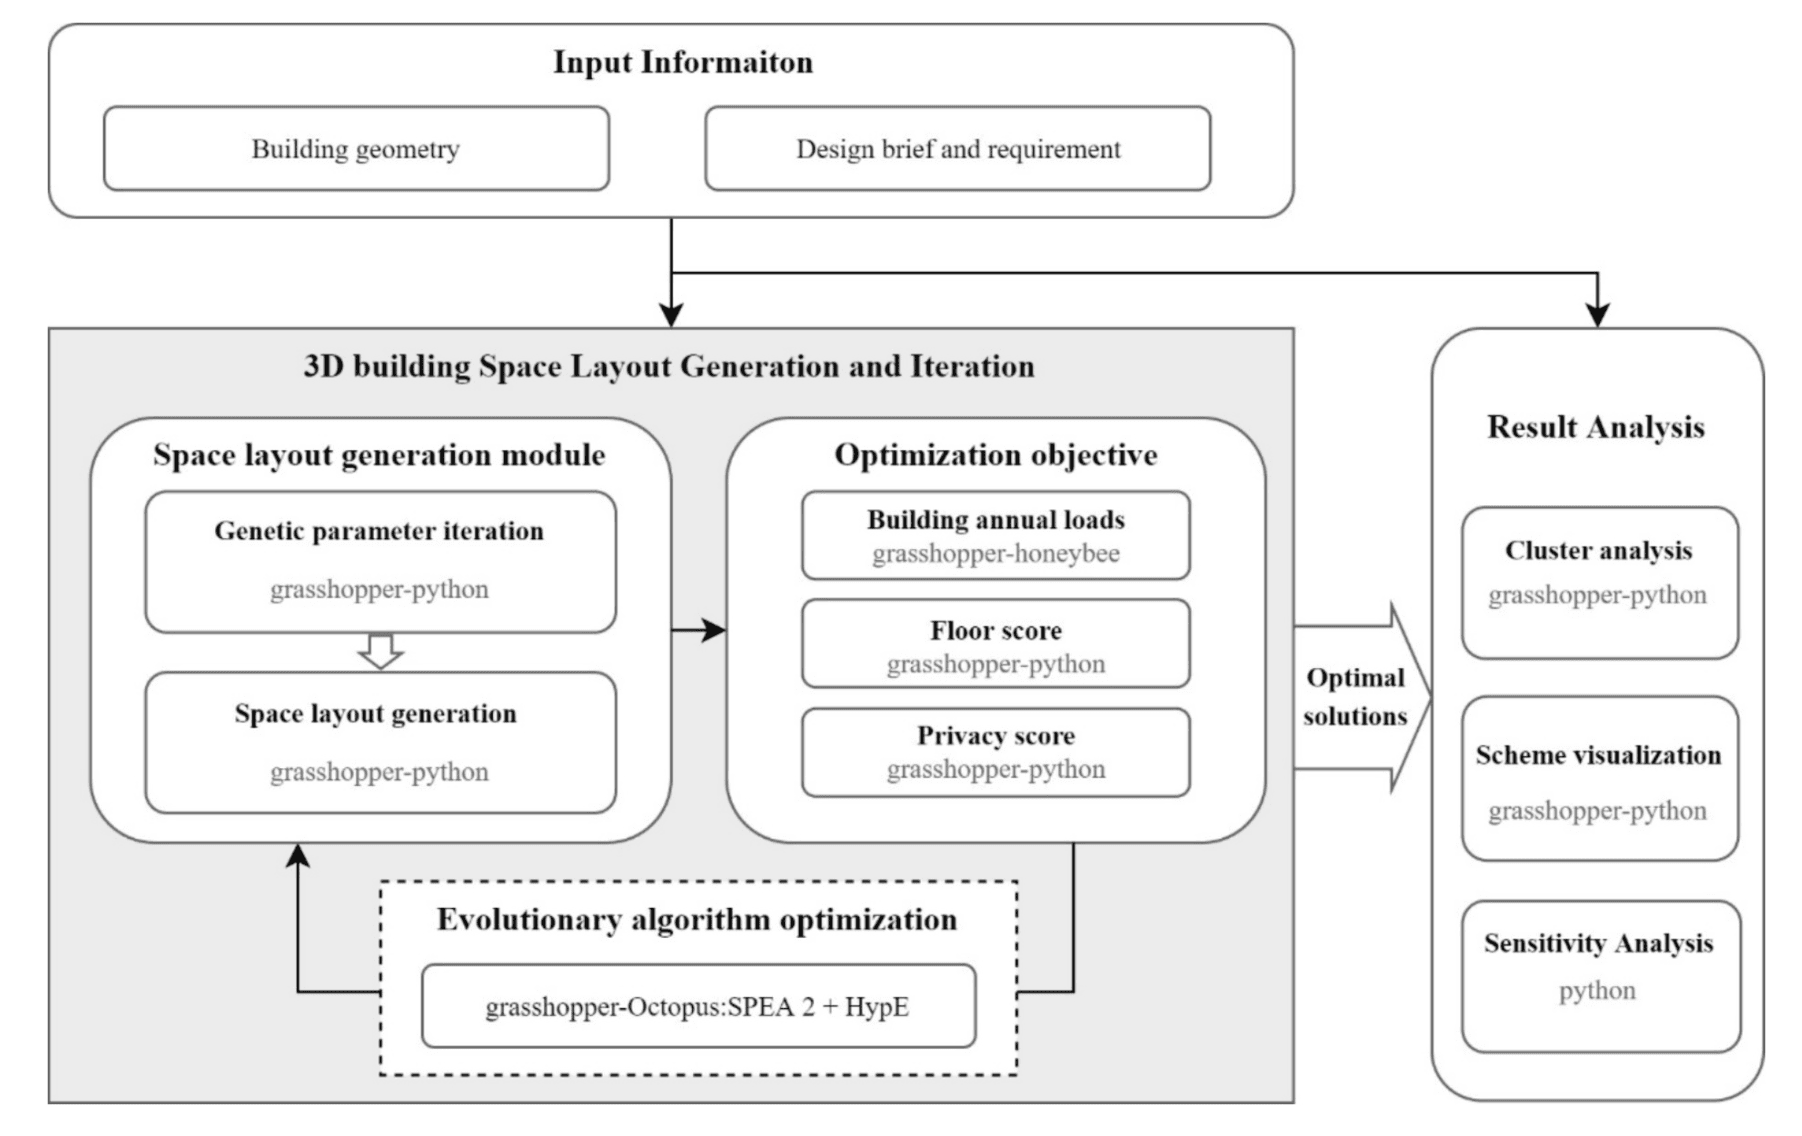
Fig. 1. Framework of energy saving building space layout generation and optimization.
Summary
This study establishes an inverse computational framework on Rhino-Grasshopper to automate 3D functional layout generation and multi-objective optimization for mixed-use high-rises. Taking a Shenzhen office tower as the case, it optimizes thermal zone topology under fixed building envelopes, cutting total energy use by up to 5.5%. Random forest and SHAP interpretable AI further identify key layout drivers, delivering targeted space-planning guidelines balancing energy load, floor rationality and privacy for early-stage architectural design.
Abstract
This research aims to explore a new method and implementation for the automated generation and optimization of energy-saving building three-dimensional space layouts for mixed-use buildings, focusing on the topological placement of spaces. A three-dimensional space layout generation method was developed in this study, integrating multi-objective evolutionary algorithms and energy consumption simulation. The proposed approach enables automated generation and evaluation of building space layouts, seeking to optimize building layouts that meet practical requirements and minimize energy consumption. In a case study, we applied our method to a high-rise office building in Shenzhen, China, generating more than seven thousand layout schemes and providing visual references for the optimized layouts, thereby validating the effectiveness of the proposed method. The experimental results revealed that the space layout, under fixed building contours and enclosures, influences building energy consumption, achieving up to 5.5% reduction in energy use for the case study building through topological optimization of thermal zone placement, with the maximum reduction primarily occurring in cooling consumption. Additionally, through analysis using random forest model and interpretable artificial intelligence, we summarized specific energy saving space layout strategies. Compared to traditional forward workflow energy prediction methods, the inverse workflow-based approach in this study can more efficiently search for optimal energy saving solutions. This method is suitable for building space layout design in multi-story and mixed-use buildings, offering adequate generalizability and applicability.
1. Introduction
According to the United Nations Environment Programme [1], operational energy consumption in buildings accounted for 30% of global energy use in 2020. As the demand for better living and working environments grows, so does building energy consumption. The early design phase is critical, influencing more than 40% of a building's energy saving potential [2]. To reduce carbon emissions and achieve carbon neutrality to combat future climate change, energy-efficient building design and system configuration is essential [3,4]. Currently, most research on passive energy-efficient design focuses on building forms and envelope performance [5,6], while the relationship between space layout and energy performance remains underexplored [7,8]. Studies have shown a strong correlation between building contours and energy performance [9–11]. At the same time, the arrangement of spaces within fixed building contours also impacts overall energy efficiency [12–15].
Given its significance in the early-design stages, designing energyefficient space layouts is a key area of study.
In recent years, advancements in computer technology have led to the development of automated building design methods that go beyond basic performance simulation [16,17]. Table 1 shows the summarization of existing research in related fields. Among these, inverse design workflows stand out for their ability to comprehensively search for optimal solutions, making them particularly promising for early-stage building design challenges [18,19]. The aim of this study aligns with the broader research domain of Performative Computational Architecture (PCA), which integrates form generation, performance evaluation, and optimization as an iterative framework for design exploration [20]. PCA has been systematically reviewed and categorized to include subdomains such as sustainability, cost, functionality, and structure, with energy performance being among the predominant optimization objectives. Within this domain, several researchers have made significant contributions to computational approaches for spatial configuration. Nourian and colleagues developed configurative design methodologies using space syntax theory integrated with parametric modeling, enabling systematic analysis and synthesis of spatial configurations [21]. Cubukcuoglu et al. applied multi-objective evolutionary algorithms to hospital layout optimization, addressing the relationship be tween spatial configuration and building functionality [22]. Wang developed performance-based building design optimization tools such as EvoMass, demonstrating how evolutionary algorithms can facilitate explorative design processes for energy performance improvement [23]. While these studies have advanced the field of computational design optimization, they have primarily focused on building massing, façade design, or functional layout for specific building typologies. The present study extends this body of work by addressing the specific challenge of interior space layout optimization for energy performance in multi-story mixed-use buildings.
Moreover, most research related to energy-efficient space layout generation recently focuses mainly on residential buildings. Michalek et al. [24,25] explored automated space layout generation using math ematical programming, aiming to control the location of spaces, the distance between walls, and window sizes to meet standards such as minimal heating and cooling demands and reduced lighting costs. Rodrigues et al. [26,27] used genetic algorithms and stochastic hill climbing techniques to optimize automatically generated space layouts for single- and double-story residential buildings, incorporating thermal comfort scores to evaluate the generated designs. Yair Schwartz et al. [28] developed an algorithm for the automated generation of smal rectangular residential layouts, integrating thermal performance anal ysis. Jingyu Zhang et al. [29] investigated the potential for optimizing energy efficiency, lighting, ventilation, and thermal comfort in the early design stages of green residential buildings. Using a case study of a residential building in Beijing, they optimized 27 design parameters and provided a performance sensitivity analysis to guide design decisions. Some previous studies have focused on high-rise office buildings. Y et al. [30,31] designed an algorithm for the automated generation of high-rise office space layouts using space-filling curves. This approach combines building thermal performance simulation with a simulated annealing algorithm to optimize thermal zoning and space layout. Du et al. [32] developed a floor plan generation algorithm for high-rise office buildings, studying the energy consumption differences between various layout configurations through energy simulation. The remaining two studies are applicable to public buildings. Ipek Gürsel Dino et al. [33,34] developed a tool using evolutionary algorithms to generate three-dimensional space layouts based on area requirements. This tool integrates with EnergyPlus to simulate energy consumption and asses daylighting performance based on window placement and size. Halawa et al. [35] proposed a mathematical model for optimizing outpatient floor plan layouts, with the goals of maximizing natural daylight and minimizing patient walking distance. The model considers constraints such as natural daylight availability, and space rotation. However, in this study, daylighting data were simulated before the floor plan optimization, and the impact of functional layout changes on overall daylighting was not considered.
To date, research on the automated generation and optimization of space layouts with a focus on green building performance remains limited, and the existing studies have their own constraints. Most research is tailored to specific building types, predominantly residential buildings [24–28,31,32]. There is a noticeable lack of study addressing other building types. In the more generalized approaches to space layout generation and optimization, some methods produce layouts with poor spatial practicality [32], or rely on energy consumption evaluation methods with limited accuracy [31,35]. Additionally, issues such as the absence of fully automated workflows [31,32] and excessive computation times further challenge the field [32]. The primary challenges in this area of research include the following aspects. First, there is the issue of matching methods with their intended application. Existing approaches are designed for single-floor layouts, overlooking the complexity of space planning in multi-story buildings and the broader implications for energy consumption. Second, the optimization of green performance in computational design often neglects the practical needs of building design, resulting in simulated “optimal” solutions that may not be feasible in real-world applications. Finally, despite advances in computational power and reduced hardware costs, users still need to perform computations within limited resources and time, which raise concerns about the practicality of these methods. To address these challenges, there is a need to develop methods that are suitable for the overall space layout of multi-story buildings, taking into account the actual demands of building design, optimizing for green performance, and ensuring efficient computation within the constraints of available resources and time. It is important to note that this study focuses on the topological arrangement and adjacency relationships of space layout within a grid-based system, rather than optimizing the morphological characteristics such as length, width, or geometric shape of individual zones. The focus is on understanding how space layout influences energy consumption and how optimizing the arrangement of these space within fixed contours can enhance energy efficiency.
2. Energy saving space layout generation and optimization
This study further develops an energy saving framework for the automated generation and optimization of building space layouts [8], based on an inverse workflow approach within automated design as shown in Fig. 1. The optimization process specifically targets the topological placement and adjacency relationships of thermal zones while maintaining their basic geometric properties as defined by the grid system. The entire workflow is implemented on the Rhino-Grasshopper platform.
This method is designed for the preliminary phase of schematic design, where the building's geographic location, external contours, the area proportions of various functions, and their attributes are known. Based on these conditions, the framework automates the internal space layout with the goal of optimizing energy consumption. The framework utilizes an inverse workflow and computational design techniques, enabling the rapid generation of diverse space layout schemes that respond effectively to area requirements through a custom-developed three-dimensional space layout algorithm module. For the inverse workflow system, the desired outcomes drive the process with algorithms determining necessary inputs to reach those desired outcomes [19]. In the context of this study, an inverse workflow involves three key steps: The inverse workflow approach begins by setting energy performance requirements and spatial needs, then applies generative algorithms to generate design layouts automatically before optimizing layouts through simulation for optimal solutions as generative algorithms produce more energy-efficient design iterations governed by performance assessment.
Table 1
Summary of existing research on energy efficient building layout generation.

Fig. 1. Framework of energy saving building space layout generation and optimization.
2.1. Methodology of 3D space layout generation
At the core of this framework is the 3D space layout generation module, which generates diverse building layout schemes based on predefined rules and parameters. This module leverages Rhino-Grasshopper and custom Python scripting to automate the arrangement of functional spaces and the creation of building models. The framework is encapsulated within Grasshopper to ensure seamless integration with the entire workflow.
2.1.1. Model grid
The space layout in this module starts with the representation of building space using a grid system that aligns with the building's column grid design. Many grid-based space layouts must adhere to orthogona grid rules, which can limit the versatility of the generated schemes, making them suitable only for simple geometric building designs [31,33]. While our approach uses an orthogonal grid-based framework, this choice aligns with practical architectural requirements as most contemporary high-rise mixed-use buildings follow orthogonal structural systems for construction efficiency, code compliance, and HVAC integration. The orthogonal constraint ensures that generated layouts remain structurally feasible and implementable. This grid module addresses this limitation by first creating an ideal 3D grid model and then projecting it onto an irregular building model, which is shown in Fig. 2.
Building volume requires systematic methods to achieve proper discretization and organization before space layout generation. Many grid-based approaches restrict themselves to creating orthogonal designs, yet contemporary architecture demands irregular building forms and nontraditional floor planning systems. Our grid projection method solves these difficulties by preserving grid advantages while working with irregular building shapes. An ideal 3D grid model starts the process by aligning with the building's structural grid (Fig. 2, left). The standard grid structure serves as a foundation for initial spatial planning algorithms while preserving structural grid alignment. The projection of the ideal grid occurs onto the actual building form to support irregular building shapes (Fig. 2, right). Spatial relationships together with architectural adjacencies are preserved during projection which adapts to the building's actual geometric form. The projection converts standard spatial units from the ideal grid into specific volumes inside the building's irregular form. The projected grid spatial units maintain their functional attributes and relationships from the ideal grid, so the space allocation logic remains functional after geometric transformation. The conceptual method links computational speed from grid systems to adaptable functionality for designing real-world buildings. The ideal orthogonal grid with uniform spatial units appears in the left diagram of Fig. 2. The units from the diagram exist on the irregular building form yet preserve their original spatial relationships in the projected visualization. The red lines in this diagram show how points between the ideal grid and projected grid maintain their corresponding positions. The transformation technique upholds space relationships between areas through adjustments to suit a building's real geometry. Our proposed grid-based approach prioritizes practical implementation over geometric flexibility, recognizing that orthogonal layouts dominate realworld construction due to structural, mechanical, and regulatory constraints. While this limits the generation of curved or organic spatial arrangements, it ensures that all generated solutions can be constructed and meet building code requirements.

Fig. 2. Ideal mesh model.
2.1.2. Model transformation process
In Grasshopper, after the building model along with other parameters are input by architect, our developed program can divide the building model into a 3D irregular grid model as shown in Fig. 3 and calculates the area of each spatial unit. The data of each unit is then transmitted to the space layout generation module, where the attributes of the grid model's spatial units are updated as shown in Fig. 3.
This method treats the space within each column grid as the smallest unit, corresponding to the spatial units in the ideal grid model. This enables the identification and processing of irregular building masses and non-orthogonal grid models. The model transformation process follows a sequence of defined operations to convert architect designs into optimized spatial models. We define the key components of this process as follows:
Building Shape:
The building's three-dimensional external shell that architects create represents the building model shape. The building's total external surface area includes exterior walls roof and floor slabs which define its volumetric boundaries. Building model shape can exist as an entire building volume or multiple individual floor volumes which will be processed independently.
Column Network:
The column network illustrates the basic structural organization of the building through its division of columns across the structure. It provides the foundational framework for spatial segmentation that enables the layout designs to follow the building's structural composition. Fig. 3 illustrates the structural rhythm of the building through a regular grid system of points that represent the column net.
Mesh Auxiliary Surface:
The intermediate geometric construct functions as an intermediary tool to transition from the regular column grid framework into the distorted building form. The generation of an auxiliary surface occurs through horizontal plane projections of the column network at different floor heights for spatial partition purposes. The transformation process remains spatially accurate because of this supporting surface.
The transformation process, illustrated in Fig. 3, proceeds through the following stages:
-
Initial Input: An architect introduces the building model shape which specifies either the total volumetric form or floor-by-floor volume requirements for analysis purposes.
-
Grid Definition: The column network serves as the foundation for spatial organization by using the building's structural system to create its regular framework.
-
Surface Generation: The mesh auxiliary surface results from the intersection of building volume planes at floor height levels combined with the laid column grid.

Fig. 3. The process of model transformation in Grasshopper.
Table 2
- Spatial Discretization: The building structure is divided into separate units through spatial segmentation which establishes appropriate dimensions for layout optimization.
The systematic approach maintains architectural integrity by allowing the spatial units to adapt to structural constraints and geometric irregularities which support a reliable layout generation process.
2.1.3. Space layout automation procedure
Here we define functional zones as different spaces comprising the building which operate with shared characteristics and occupancy patterns and environmental needs. Building design relies heavily on func tional zoning as a fundamental concept for multiple reasons. Space management efficiency becomes possible because various activities receive proper groupings based on operational similarities. The operational needs of office settings call for stabilized environmental factors during standard working hours, but retail environments need different heating ventilation and air conditioning schedules and public entrance restrictions. The implementation of functional zoning leads to energy efficiency through systematic environmental control that follows usage patterns. Building codes and regulations require different usage types to remain separate which becomes possible through functional zoning.
The space layout generation module requires two sets of input parameters. The first set includes fixed parameters containing user-specific requirements, detailing the information for each functional zone as illustrated in Table 2. These parameters define the needs for layout generation and the conditions under which the generation process should terminate. The second set comprises rule parameters related to the generation process, which are variable and used to produce different layout outcomes as shown in Table 3. Gene data regulates growth patterns yet produces different layout configurations by varying its parameters. Starting units establish the initial starting points for each functional zone growth which impacts the optimized final layout arrangement. Each zone's growth extent in the north–south-east–westup-down directions can be controlled by growth steps which expand more for larger step lengths in the desired direction. The growth direction sequence establishes the ordering system for each zone's growth patterns which shapes how zones expand together with their neigh boring areas.
The 3D space layout generation algorithm considers the area requirements and spatial connectivity of functional spaces. In this algorithm, the concept of “growth” refers to the expansion of a vacant adjacent spatial unit to match the state of an existing unit, which is indicated in Fig. 4, thereby increasing the area of a specific zone. The zone growth process initiates by assigning starting units for functional zones through parameters from gene data. Each selected starting unit operates as a seed which drives growth within its designated zone. The growth of zones follows their designated step lengths and direction sequences by means of stepwise unit incorporation into neighboring empty spaces that start at their assigned initial points. The algorithm maintains ongoing constraint monitoring throughout the growth procedure, which is indicated in Fig. 4.
Building program input parameters (fixed parameters): definitions and constraints.
Table 3
Layout generation control parameters: user-defined growth rules.
The system verifies the current area against the required area demand and enforces floor space regulations. The system must preserve minimum area tolerances from beginning to end while meeting all vertical access requirements. The process keeps growing until every zone achieves its target area range or space limitations prevent additional development. The design undergoes complete validation testing with all established input limits to prove its feasibility. Fig. 4 shows the concept of zone development using three essential elements. An initial state diagram illustrates the assigned starting units that appear in the left part of the illustration. The middle diagram shows a structure that controls growth through input parameters combined with gene data that determines expansion patterns. The right diagram illustrates zone development and interaction by displaying different functional zones through colored areas alongside directional arrows. The optimization approach generates layouts which match practical requirements while providing numerous spatial configuration possibilities during the computation process. The algorithm utilizes fixed input parameters alongside variable gene data to generate multiple viable solutions which satisfy architectural constraints.
2.1.4. Space layout generation algorithm
The corresponding pseudocode is presented in Algorithm 1 and Algorithm 2. The implementation of this process is done using Python. This method relies on changes in the state of adjacent spatial units, guided by different rule parameters during the generation process. Through appropriate initial unit allocation and a continuous process of growth and filling, this method can quickly and effectively generate 3D space layouts that meet specified area and layout characteristics. The detailed procedure of the algorithm will be elaborated here:
• Algorithm 1: Main Layout Generation Algorithm
The main layout generation algorithm leads to all operations being required to generate a valid spatial arrangement. The algorithm generates vertical circulation features while directing functional areas for growth and checks for successful space usage throughout the building.

Fig. 4. Illustration of the space layout growth process: (a) Initial state with starting units (b) Parameter structure and data flow (c) Zone growth progression
The algorithm operates on three primary inputs: program, gene_data, and info_data. Program input serves as the starting point of spatial modeling by defining each unit as unassigned space with zero value. The gene_data includes the control parameters that regulate growth patterns, but info_data holds all building requirements and constraints. The algorithm generates result_program as its output, which shows a fully allocated spatial design with each grid cell designated to serve a particular purpose. The result_program contains spatial units described by x, y, z coordinates that locate them as well as zone identifiers to specify their functions and unit area measurements and floor levels and adjacency details. Multiple essential steps guide the algorithmic process. The system begins by generating the vertical circulation layout with creat_transport_plan before placing core elements according to building needs. After the core elements are established, the algorithm extends them through the entire vertical space using creat_vertical_mass. Through grow_program the algorithm starts developing various functional areas at the same time. The last stage of the algorithm utilizes fill_program to finalize the design when unassigned space areas remain.
• Algorithm 2: Iterative Growth Algorithm
The iterative growth algorithm directs the step-by-step expansion of functional zones starting from their established positions. The algorithm follows zone growth principles while ensuring spatial connectivity while upholding area requirements throughout its generation steps. The algorithm follows a sequential order, starting by assigning initial starting positions for each functional zone through analysis of gene_data. The system uses starting locations to generate zones through defined movement steps while monitoring area measurements before modifying zone growth patterns. The algorithm simultaneously manages zone growth conflicts while conducting constraint-based verification on final layouts.
The algorithm maintains ongoing surveillance of multiple factors throughout the zone growth operation. The system tracks the actual areas against required areas for every zone while enforcing floor-level rules and adjacency patterns and validating the minimum area specifications. The algorithm enables zone growth until three conditions occur: the zone achieves its required size within tolerance or spatial limitations prevent additional expansion or zone conflicts need to be resolved. If a zone fails to obtain its designated area through regular growth the al gorithm begins a new growth sequence at a separate starting point. The method balances effective area distribution with coherent layout design. The result_program emerges from this method through the coordinated effort of both algorithms to generate a valid spatial layout which fulfills every specification and constraint. The final design layout accomplishes functional interconnections while achieving maximum performance requirements.
The success of these algorithms depends on their ability to manage intricate spatial relationships while accommodating real-world con straints. The main algorithm establishes the fundamental framework to achieve full space utilization while the growth algorithm defines specific zone expansion procedures. The dual-algorithm system enables sys tematic space planning along with adaptable responses to buildingspecific needs.
Algorithm 1. (3D spatial layout generation algorithm pseudocode)
Algorithm 1 3D Space Layout Generation Algorithm
Input : program, gene_data, info_data
Output : result_program
1: Generate the layout for vertical circulation.
2: vt_plan = creat_transport_plan(program, gene_data, info_data)
3: Execute vertical growth of the vertical circulation.
4: program = creat_vertical_mass(program, vt_plan)
5: Perform synchronous growth for multiple connected regions.
6: result_program = grow_program(program, gene_data, info_data)
7: If any spatial units remain unfilled, continue growth until all units are filled.
(continued on next page)
(continued )
Algorithm 1 3D Space Layout Generation Algorithm
8: if len(program.get_attr_unit_seq(0)) > 0 do
9: result_program = fill_program(result_program, gene_data, info_data)
10: end
Algorithm 2. (Iterative growth algorithm pseudocode)
Algorithm 2. grow_program
Input: program, gene_data, info_data
Output: program
1: Set the starting point according to the gene_data.
2: program = set_start_point(program, gene_data.start_unit)
3: Grow the zones according to the gene_data until all zones have completed growth.
4: while bool(finish_check) = True do
5: stop_check = [True] * info.zone_count
6: Grow according to the direction sequence in the gene_data.
7: for dir in gene_data.direction do
8:    for zone in info_data.zone do
9:    Grow according to the step length in the gene_data.
10:    for step in gene_data.step_len[zone][dir] do
11:    Iterate through the spatial units in this zone.
12:    for unit in program[zone] do
13:    If the neighboring spatial unit in the growth direction is vacant, grow into that unit
14:    as part of the zone.
15:    grow_unit = get_neighbor_unit (program, unit, dir)
16:    if grow_unit.attribute == 0 do
17:    program[grow_unit].attri = zone
18:    stop_check[zone] = False
19:    Check if the zone meets the required area; if so, mark the zone as completed.
20:    if info_data.area_demand[zone](1-info_data.area_tolerance) <= cal_area(zone) <= info_data.area_demand[zone](1 + info_data.area_tolerance) do
21:    finish_check[zone] = True
22: If a zone cannot continue growing and has not met the area requirement, select a vacant unit as the new starting point.
23:    for zone in info_data.zone do
24:    if finish_check[zone] == False and stop_check[zone] == Ture do
25:    new_start_unit = get_vacant_unit(program)
26:    program[new_start_unit].attri = zone
end
The space layout generation algorithm illustrates its capabilities and flexibility by producing two dissimilar layout schemes from random rule parameter inputs as shown in Fig. 5. The schemes present threedimensional spatial building organizations which are illustrated through floor plans combined with three-dimensional exploded views. The floor plans in the figure utilize consistent color coding to depict zones with different spatial usage yet maintain visual consistency across all presentation views. The two schematic representations (Scheme A on the left and Scheme B on the right) demonstrate that varying rule parameters can yield distinct yet coherent spatial designs. Each scheme is presented through multiple representation methods: spatial relationships become fully understandable thanks to floor-by-floor plans sectional views and axonometric projections.
The algorithm in Scheme A created a dense functional area distribution which becomes visible through adjacent floor zone clustering. The vertical circulation core (depicted in grey) maintains its position steadily across the entire building height through the algorithm's continuous vertical capability. The architectural floor plans demonstrate an organized spatial distribution scheme where expansive areas extend from each building edge toward its interior. The functional distribution in Scheme B shows distinct arrangements that differ from the approach in Scheme A. Different rule parameters within this scheme produce diverse spatial patterns that fulfill all programmatic needs. The floor plans display space distribution by intricate functional zone interlocking but maintain appropriate proximity relationships between zones. Vertical circulation integrates with the surrounding environment in Scheme B through a layout that modifies space distribution compared to Scheme A.
The developed schemes demonstrate comprehensive compliance with key operational criteria. Each function receives assigned area spaces in accordance with specified requirements and maintains continuous vertical movement throughout the constructed building. The functional areas within the design maintain physical continuity between their zones so spaces remain usable, and all areas maintain proper interconnectivity throughout the overall organization of spaces. The algorithm demonstrated computational efficiency by producing fifty layouts per second during performance testing. Rapid solution generation through the algorithm allows designers to evaluate multiple viable solutions during optimization. The illustration establishes the algorithm's capability to handle various building design approaches as it produces spatial layout solutions for normal floor plans and unconventional floor plates.
2.2. Multi-objective optimization of space layouts
The goal of layout optimization in this study is to identify the optimal solution for building energy performance that meets the functional requirements of the building. To achieve this, a multi-objective evolutionary algorithm (MOEA) [36] was applied. The research utilized the Octopus plugin for Grasshopper as the tool platform for this purpose [37,38].
2.2.1. Decision variables
The decision variables in this problem are the different space layouts under the same conditions. There are three sets of gene parameters used in the evolutionary algorithm, each corresponding to a space layout scheme. The layout images and generation rule parameters represent the phenotype and genotype in the genetic algorithm, respectively. More over, because the original parameters are non-continuous and have varying ranges, all gene variables are linearly mapped to the interval. This uniform mapping ensures consistency in the value range of each gene, preventing issues that could arise from mismatched value ranges.

Fig. 5. Space layouts generated using random gene data.
2.2.2. Optimization objectives
2.2.2.1. Annual load. In this study, the annual load, denoted as , is used to evaluate the energy efficiency of the building design, measured in . This metric represents the total energy consumption of the building over a year, divided by its total floor area. The energy consumption includes heating, cooling, lighting, and equipment loads, as shown in Equation (1). The simulation tool used for this calculation is the Honeybee plugin, which is based on EnergyPlus.
The simulation accounts for various factors affecting each load type: The heating load analysis combines the evaluation of building envelope heat losses with ventilation demands and internal heat generation. The simulation allows thermal transmission analysis of walls and roofs while considering window performance together with mate rial properties and operational schedules for different zones. Computing the cooling load requires consideration of solar heat gains from windows together with occupant heat production and equipment usage and building envelope thermal behavior. This building component draws its performance directly from the functional space configuration since zones featuring various occupancy patterns and heating contributions determine total cooling needs. The calculation of lighting load depends on the illumination needs of different functional areas together with their scheduled operating times. This study adopts conventional lighting design principles that calculate lighting load from space area and functional requirements yet spatial placement affects total lighting energy use by affecting various zones' operational schedules. Qequipment represents the total energy consumption from electrical equipment and appliances which operate within separate functional areas. Equipment densities differ substantially across different space types because office areas contain denser equipment distribution than circulation or storage spaces.
Simulation requires precise hourly schedules detailing occupancy patterns together with lighting and equipment usage dynamics across different functional spaces. External environmental conditions consisting of temperature and humidity and solar radiation and wind patterns found in location weather data affect heating and cooling requirements for the building. Using E as a base metric allows the optimization process to determine how spatial design choices impact the building's total energy efficiency. The algorithm achieves optimal results by utilizing this extensive method which discovers spatial configurations that reduce overall building energy usage alongside maintaining operational needs.
2.2.2.2. Floor allocation score. This score assesses the rationality of the space layout across the floors of a multi-story building. Users can specify whether certain functions should be located on higher or lower floors. The 3D space layout generation module calculates the floor allocation score to evaluate and optimize these layouts, as shown in Equation (3). A score closer to one indicates a less optimal floor allocation, while a score closer to zero indicates a more suitable allocation. The final score is calculated using a weighted average (Equation which assigns greater weight to more significant scores, thereby minimizing overly unreasonable layout results.
Floor allocation score for the space area.
F: Total number of floors in the building.
Floor number where the functional area is located.
Floor height requirement; h indicates a preference for higher floors, l for lower floors.
The score reflects several practical considerations in vertical space planning. For instance, when (preference for lower floors), this typically applies to functions requiring direct public access or heavy equipment placement. Examples include retail spaces, lobbies, or mechanical rooms. The score improves as these functions are placed closer to the ground floor, where approaches one. Conversely, when (preference for higher floors), this applies to functions benefiting from elevation, such as executive offices or residential units. The score im proves as these functions are placed on higher floors, where approaches zero.
The cubic term in the numerator of the overall score serves to amplify the impact of poor placements, making the score more sensitive to significant deviations from desired locations. This heightened sensitivity helps the optimization algorithm identify and correct problematic vertical arrangements more effectively. The squared term in the denominator provides normalization while maintaining the emphasis on larger deviations.
For example, in a 10-story building where retail space is placed on the second floor:
, indicating a relatively good score due to proximity to ground level.
However, if placed on the eighth floor:
resulting in a poor score that would significantly impact the overall evaluation. This scoring method helps ensure that the generated layouts not only meet energy efficiency goals but also conform to practical operational requirements in multi-story buildings. The score becomes particularly important in mixed-use buildings where different functions have distinct vertical placement preferences based on accessibility, security, and operational considerations.
2.2.2.3. Privacy score. The privacy score draws on the concept of connectivity from space syntax theory, which assesses the rationality of spatial adjacency in the overall building layout, thereby evaluating the degree of privacy of functional areas [39]. Connectivity refers to the number of connections a node has with other nodes, describing the relationships and accessibility between different spatial elements. In this scoring system, each functional area is treated as an independent spatial element, with its connectivity defined by the number of adjacent functional types; more adjacent types indicate higher connectivity.
When certain building space is designated as privacy driven, the 3D space generation module calculates the privacy score based on its adjacency to incompatible functions (Equation (4). For each functional area with privacy requirements, the number of incompatible adjacent functions is tallied to compute the privacy score. A score closer to zero indicates better privacy. Similar to the floor allocation score, the overall privacy score for the layout is calculated using a weighted average (Equation (2) to mitigate overly unreasonable optimization outcomes.
Privacy score for the functional area.
Fui : Space use of the adjacent area.
: The spaces compatible to the use.
: Number of adjacent areas to the space area.
Total number of space types.
Cm: Number of compatible space types.
The formula evaluates privacy based on the proportion of incompatible adjacent functions relative to the total possible incompatible relationships. A lower score indicates better privacy performance, with zero representing ideal privacy conditions where a space is surrounded only by compatible functions. Like the floor allocation score, the overall privacy score for the layout uses a weighted average to emphasize sig nificant privacy violations as indicated in Equation (2).
The proposed calculation and evaluation method amplify the penalty from negative impacts of poor privacy conditions, helping the optimization algorithm identify and address problematic arrangements. The cubic term in the numerator ensures that layouts with severe privacy violations are more heavily penalized than those with minor infractions. The compatibility relationships between functions are predefined based on typical architectural programming requirements. This scoring approach helps ensure that generated layouts maintain appropriate functional relationships while respecting privacy requirements. However, it should be noted that this metric focuses primarily on spatial adjacency and functional compatibility. More complex privacy considerations such as visual exposure, acoustic isolation, or security zoning would require additional evaluation metrics.
2.3. Results clustering
The results clustering module employs the k-means clustering algorithm [40] to analyze and group the generated Pareto front solution [41] based on the similarity of their optimization objectives. This module is implemented in Python. By applying k-means clustering to the Pareto front solutions, the decision-making process is significantly simplified, enabling users to quickly identify representative optimized solutions. Once the clustering process is completed, the visualization module in Grasshopper provides a detailed visual representation of the solution within each cluster that has the lowest annual load. The visualization includes floor plans for each solution, building energy consumption data, building zoning models, and schematic diagrams of the building's energy model. These visualizations provide architects with direct and easy-to-understand design references.

3. Case study
3.1. Experiment information of case study
In this research, a case study was conducted on a high-rise mixed-use office building located in Shenzhen, Guangdong Province, China. The case building has 19 floors, with a total floor area of 19,400 m2. The building’s shape and the functional zones to be arranged are illustrated in Fig. 6, while the basic parameters and information for each functional area are listed in Table which provides the fundamental energy modeling parameters including per capita occupied building area, electrical equipment power density, and illuminance power density for each functional zone.
The experiment employs a traditional lighting design where the lighting load is solely related to the building area. Detailed schedules for occupancy schedule, lighting schedule, and heating and cooling settings are provided in the appendix, with Fig. 7 offering a more intuitive visualization of the different patterns of human activity within each functional area.
The occupancy schedules shown in Fig. 7, combined with the power density values specified in Table 4, determine the hourly end-use energy intensities used in the energy simulation. For each functional space, the actual lighting and equipment loads vary throughout the day as occupancy percentages are applied to the base power densities. For example, open office spaces reach maximum lighting intensity of (95% occupancy power density) during peak working hours, while
Table 4
Simulation parameters for heat gain in different functional zones.

Fig. 6. Building shape and visualization of building energy simulation model in EnergyPlus.

*On holidays, occupancy ratio = 0 in close office, open office, IT room, meeting room and canteen
Fig. 7. Schematic diagram of the personnel activity schedule.
equipment loads reach (95% occupancy power density) during the same periods. Similarly, IT rooms achieve peak equipment intensities of when fully occupied, reflecting their higher equipment power density requirements.
The simulation analysis uses typical meteorological year data for Shenzhen. The window-to-wall ratio is set at 30% for the front and rear façades and 50% for the side façades. These values reflect typical design practice for high-rise office buildings in Shenzhen's hot-summer and warm-winter climate zone, where contemporary commercial buildings commonly adopt similar or higher glazing ratios due to the widespread use of curtain wall systems. The thermal conductivity coefficients for the building envelope materials are also specified in Table 5. The integration of the 3D functional layout module with the Honeybee module allows the program to automatically establish the building envelope based on preset window-to-wall ratio parameters, thereby facilitating the auto mated construction of the building's energy model.
The commercial area and canteen were placed on the lower floors to improve accessibility, while the dormitories were positioned on the upper floors to minimize interference from other functions. The commercial area and canteen areas were designated as public spaces, meaning that these areas were excluded from privacy scoring. The dormitories were designated as independent, private spaces with no associated functions. The closed office, open office, IT rooms, and meeting rooms were grouped as related functional clusters. When these functions were placed adjacent to each other without other neighboring functions, the corresponding design would receive a higher privacy score. The respective module would calculate and analyze the floor allocation score and privacy score of different layout schemes based on these settings to evaluate the rationality of the designs.
In the evolutionary algorithm, the population size is 50. The elitist strategy was implemented by retaining high-fitness individuals and directly passing them to the next generation, helping to preserve the best solutions. The proportion of elite individuals was set at 10%. Mutation operations were employed to increase the diversity of the search space, avoiding local optima. The mutation rate and probability were set at 30%, meaning that a small number of individuals in each generation will undergo mutation to increase diversity. The experiment used a maximum iteration count of 100 as the optimization stopping criterion to avoid unnecessary computations.
Table 5
Material of building envelope.
3.2. Optimization results and analysis
After 80 iterations, a total of 7,368 historical solutions and 28 nondominated solutions had been generated. The historical solutions and the Pareto front surface from the 1st to the 80th generation are shown in Fig. 8. Table 6 presents the range of objective parameters and the maximum reduction achieved across all historical solutions. The annual load per unit building area for all historical solutions ranged between and ), with a difference of 14.78 and a maximum reduction of 5.51%. This reduction was achieved through topological optimization of thermal zone placement, with cooling load contributing the most significant portion of the energy savings.
Throughout the 80 iterations, the average annual load per unit building area decreased from an initial to 258.3 by the 80th generation. The minimum value also dropped from 258.33 in the 1st generation to a lowest point of 253.3 by the 75th generation (Fig. 9). The floor allocation scores of all historical solutions range between 0.02 and 0.98, with concentrations near the regions close to 0 and 1. The minimum floor allocation score of the historical solutions was approximately 0.06 in the first generation, dropping to its lowest at 0.02 by the 12th generation and remaining stable thereafter (Fig. 10), approaching the most ideal floor layout situation. The privacy scores of all historical solutions range from 0.37 to 0.62, with the minimum value dropping from 0.42 in the first generation to its lowest point in the 35th generation and then stabilizing (Fig. 11).
The experiment clustered the 28 Pareto front solutions into three clusters, and the solution with the lowest annual load in each cluster was selected for visualization as shown in Table 7 and Fig. 12. All three solutions showed good performance in terms of space layout rationality. The canteen and commercial areas were arranged on the lower floors, while the dormitories were concentrated on the upper floors, with floor scores close to zero. The optimization process also considered the compatibility of adjacent functions, and the privacy scores of the three solutions were among the best across all historical solutions.

Fig. 8. Optimization results of multi-objective optimization.
Table 6
All historical solution parameter ranges.
3.3. Sensitivity analysis using interpretable machine learning method
In this section, random forest models were developed using all his torical solutions generated during the optimization experiment as the sample data. Machine learning, compared to traditional correlation analysis, can capture complex nonlinear relationships and handle highdimensional data, while interpretability tools allow us to gain a more intuitive understanding of the model's decision-making process [42]. The prediction results of the random forest model were then subjected to interpretable artificial intelligence analysis [43] to perform a sensitivity analysis of architectural elements in the building's space layout. This analysis aimed to further explore the differences in the impact of various design elements on building energy consumption.
Random forest was selected over other machine learning models for several specific advantages in this architectural context: (1) it effectively handles the mixed categorical and continuous features present in our spatial layout data, (2) it provides robust performance with relatively small datasets (7,368 samples) without requiring extensive hyperparameter tuning, (3) it naturally handles feature interactions between spatial characteristics without manual feature engineering, and (4) it offers built-in feature importance rankings that align well with SHAP interpretability analysis. Compared to neural networks, random forest provides better interpretability for architectural decision-making, while outperforming linear regression in capturing the complex nonlinear relationships between spatial arrangements and energy performance. Alternative tree-based methods like gradient boosting were considered but random forest was preferred for its reduced overfitting risk and computational efficiency in this specific application.
In constructing the random forest model, the focus was on features related to building layout, detailed in Table 8. Seven orientations of different functional areas were selected, recording the projection lengths of the envelope structures on four façades to assess their impact on energy consumption predictions. The average spatial area of each functional area was also considered to explore how layout concentration or dispersion affects predictions. Overall, the study examined functional orientation and area size, aiming to provide design recommendations based on these factors.
All historical solutions were split into a training set and a testing set in an 8:2 ratio. The features listed in Table 8 were used as influencing factors, and the annual load of the building was used as the dependent ——Average annual load of the building for historical solutions 0—Minimum annual load of the building for historical solutions —o—Average annual load of the building for Pareto front solution
——Average privacy score of the building for historical solutions —o— Minimum privacy score of the building for historical solutions

Fig. 9. The change in annual load in 80 iterations.

Fig. 10. The change in floor allocation score in 80 iterations.

Fig. 11. The change in privacy score in 80 iterations.
variable for training the random forest model. The random forest model was implemented using Python's scikit-learn library with parameters optimized through 5-fold cross-validation and grid search. The optimi zation explored the following parameter space: n_estimators= [50,100,200], max_depth = [None, 10, 20, 30], min_samples_split= [2,5,10], and max_features = ['sqrt', 'log2′, None]. The final optimized configuration consisted of n_estimators = 100, max_depth=None, min_samples_split = 2, min_samples_leaf = 1, max_features='sqrt', and random_state = 42. This hyperparameter set achieved the best crossvalidation score of 0.87 (±0.03 standard deviation) across folds. The trained model was then evaluated using the testing set.
The model's fit is shown in Fig. 13, with a root mean square error of 0.8 (indicating a relatively low value) and a coefficient of determination (R2) of 0.89. The small gap between training R2 (0.91) and testing R2 (0.89) indicated minimal overfitting, confirming the robustness of the parameter selection. Overall, the model performed well with errors within an acceptable range, demonstrating that the model has strong explanatory ability for the data. The choice of random forest proved
Table 8
Table 7
Details of the clustering result scheme.


Fig. 12. Plan of the space layout scheme for the clustering results.
Building function layout characteristics and their abbreviations.
appropriate for this application, as evidenced by the strong R2 value of 0.89 and low RMSE, while maintaining the interpretability necessary for generating actionable architectural design guidelines. The model's ensemble nature provided stability across different spatial configurations, avoiding the potential instability of single decision trees while remaining more interpretable than black-box approaches.
After completing the training of the random forest model, we use Explainable Artificial Intelligence SHAP [44] to conduct further analysis of the model’s predictions, aiming to identify the energy saving drivers among different scenarios. The results of the SHAP value analysis are presented in Fig. 14 and Fig. 15.
The average partition area of the dormitory shows a significant impact among all features. Fig. 16(a) demonstrates a clear negative correlation between the average partition area of the dormitory and its SHAP value. In other words, as the average partition area of the dormitory increases and the layout becomes more concentrated, the predicted overall building energy consumption is likely to decrease. Additionally, the average partition area of the closed offices also has a noticeable impact. Specifically, when the average partition area of close offices exceeds 350 , the predicted annual load is lower compared to scenarios where the average partition area is less than (Fig. 16 (b)). Thus, a centralized layout of unit offices provides better energy performance than a completely scattered layout.

Simulated building annual loads(kW·h/m²)
Fig. 13. Fit of the random forest model.

Fig. 14. Bar plot of SHAP values.
Among the orientation features of various functions, the southeast orientation of dormitory is the most prominent. As shown in Fig. 16(c), when dormitory is oriented towards the southeast, it leads to higher energy consumption predictions. However, it also indicates that at the same southeast orientation area, the SHAP values have a wide vertical distribution, suggesting significant cross-influence from other feature elements. Therefore, the layout needs to consider the impact of other factors comprehensively. Secondly, the northwest orientation of the canteen, when greater than 150 m2, is likely to result in higher energy consumption predictions. Thus, avoiding excessive northwest orientation for the canteen is also an energy-efficient layout strategy.
The local force plot analysis results for the samples with the lowest, median, and highest cooling and heating load values are shown in Fig. 17. In the predictions for cooling and heating loads across the three samples, the average partition area of the dormitory plays a crucial role. In the sample with the lowest cooling and heating loads (Fig. 17(a)), the average partition area of the dormitory (DO-AVS = 616.87) is close to the maximum (Fig. 16(a)), nearly occupying an entire floor; the average partition area of the closed offices (CO-AVS = 355.40) is also relatively large, significantly reducing the predicted cooling and heating load values. In the sample with the highest cooling and heating loads (Fig. 17 (b)), the average partition area of the dormitory is relatively small (DO-AVS = 365), while larger areas of commercial functions oriented northeast (SH-E = 128) (Fig. 16(e)) and larger areas of dormitories oriented southwest (DO-S = 188.6) contribute to the highest predicted cooling and heating load values. In the median sample as shown in Fig. 17(c), the larger average partition area of the dormitory (DO-AVS = 468.25) and the larger partition area of closed offices (CO-AVS = 428.8) slightly reduce the predicted cooling and heating load values, but the larger southwest orientation of the meeting function (ME-S = 295.2) leads to an increase in the predicted load values. The experimental SHAP local analysis results also validate the global analysis, indicating that in climates characterized by hot summers and mild winters, such as in Shenzhen, concentrating dormitory functions alongside closed office spaces can achieve better energy-saving outcomes in functional layouts.

Fig. 15. Summary plot of SHAP values.
4. Discussions
This study shows the potential of improving building energy efficiency via automated space layout generation and analysis. The results offer important insights regarding the relationship between spatial organization and energy performance in buildings as well as the benefits and limitations of computational approaches to architectural design. Notably, the 5.5% reduction in energy consumption by optimizing the space layout alone was achieved without changing the building's external form and envelope properties or mechanical systems. This energy reduction specifically resulted from optimizing the topological arrangement of thermal zones − their placement and adjacency relationships of individual space use. This finding is consistent with pre vious research that has pointed to the importance of spatial internal configuration on building energy performance and goes further than previous studies by determining the potential savings in a high-rise, mixed-use context. Such meaningful energy reductions achieved purely through spatial reorganization suggest that space layout optimization could be a cost-effective strategy to enhance building performance when changes to the building envelope or systems are constrained by practical or economic conditions.

(a) SHAP value relationship for the average partition area of dormitory

(b) SHAP value relationship for the average partition area of close office

(c) SHAP value relationship for southeast orientation of dormitory

(d) SHAP value relationship for northwest orientation of canteen

(e) SHAP value relationship for northeast orientation of commerce

(f) SHAP value relationship for southeast orientation of conference
Fig. 16. Relationship plot of SHAP values of influencing factors.
Through machine learning analysis, several key patterns of energy efficient layouts are identified, which could provide hints and guides for architectural design. The strong correlation between concentrated dor mitory areas and reduced energy consumption implies that grouping similar functional spaces could be more energy efficient than dispersed arrangements. This result is likely due to the ability to optimize HVAC zoning and operations for groups that have similar occupancy patterns and thermal requirements. Likewise, the performance of centralized office arrangements relative to scattered arrangements is observed to be similar, which offers practical guidance for the design of commercial buildings. The methodology of combining automated layout generation with multi-objective optimization introduced in the study is a significant advancement in computational design approaches. This work contributes to the Performative Computational Architecture (PCA) research domain by demonstrating how the three core phases of form generation, performance evaluation, and optimization can be effectively integrated for interior space layout design. Compared to previous work that considered single floor plans or simplified geometric representations, our approach successfully deals with three-dimensional space planning while retaining practical constraints. Our work demonstrates that en ergy savings can be achieved through optimizing the topological arrangement of interior spaces alone, thus expanding the scope of performative design optimization to include space layout as a significant design variable. Computational methods can provide the potential to augment human design processes by rapidly exploring the solution space beyond that which is practical through traditional methods: the ability to generate and evaluate thousands of viable layout options (7,368 in our case study) illustrates the potential for computational methods to enable rapid exploration of the solution space in a way that would not be practical through traditional methods. Nevertheless, some limitations and challenges in this approach are worth acknowledging. The method optimizes energy performance, floor allocation and privacy, but fails to account for other architectural qualities that are difficult to quantify and capture in computational requirements. The spatial quality, views, flexibility for future changes, and subjective user preferences are difficult to encode in algorithmic form. Moreover, the present version is based on the regular grid-based layout, and this may not take full advantage of the opportunities for more fluid or organic spatial arrangements.

(a) Shap value force plot for the sample with the lowest heating and cooling load

(b) Shap value force plot for the sample with the highest heating and cooling load

(c) Shap value force plot for the sample with the median heating and cooling load
Fig. 17. Shap local analysis graph.
The clustering analysis of Pareto optimal solutions offers an insightful bridge between computational optimization and practical design implementation. This approach allows us to identify distinct families of solutions with similar performance characteristics, thus improving designability of the optimization results. The method does not present a single 'optimal' solution but rather that there are a number of valid ways of achieving energy efficiency whilst meeting other design objectives. The interpretable machine learning analysis provides insight into the drivers of energy performance in spatial layouts. Specific features such as dormitory concentration level and façade orientation preferences can be identified and used to generate actionable design guidance while also demystifying the black box nature of optimization algorithms. This approach is especially promising because it could be used to develop design guidelines and provide architects with energy efficient space planning strategies.
This research looks forward to several promising directions for future investigation. The method could be expanded to include other performance metrics, like daylighting quality, natural ventilation potential, and occupant satisfaction. Additionally, future work could integrate envelope design parameters, such as window-to-wall ratios differentiated by façade orientation, as optimization variables alongside space layout generation to further enhance passive energy-saving strategies. The optimization framework provides scope for more sophisticated approaches to the representation and evaluation of qualitative design criteria. The application of this method to other building types, other climates, and other cultural contexts can contribute to the development of a more complete picture of spatial planning strategies that are energy efficient. This research also points to the ways in which computational design tools can enable rather than displace human designers from a practical implementation perspective. Viewed in this light, the automation of layout generation and evaluation can be conceived as a means of enhancing human creativity and intuition, by rapidly exploring design space and directing attention to promising avenues of further development. Nevertheless, once optimized solutions are finally translated into realized buildings, many other factors will need to be taken into account that cannot be captured in computational models. Our findings are also a contribution to computational design optimization research and offer practical insights for architects and building designers who want to achieve energy efficiency through spatial planning. The ability to achieve energy savings through layout optimization alone demonstrates this approach has the potential to be valuable tool in the early design stage for sustainable buildings.
5. Conclusion
This study develops a computational framework that optimizes building energy performance through automated space arrangement processes for analyzing interior spatial arrangements when maintaining a static building facade. Computational methods allow us to analyze the energy optimization potential that exists within early architectural design stages. The framework utilizes an inverse workflow to develop 3D space layout generation capabilities while using evolutionary algorithms to produce automated space layouts for energy simulations in the Rhino-Grasshopper platform. The method uses geometric requirements alongside spatial syntax systems to output functional layouts with effi cient energy use.
The case study in this research demonstrates that space layouts can significantly impact on building energy consumption, achieving up to 5.5% energy savings under fixed building shape. The proposed method not only generates compliant layout schemes but also provides userfriendly visualizations for designers. Additionally, sensitivity analysis using a random forest model and explainable AI offers specific energy saving layout strategies. Compared to research that considers only single-floor plans, this method is applicable to multi-story building functional layout design, allowing for better consideration of the overall layout's impact on building performance. Additionally, due to the grid projection representation in three-dimensional functional layouts, it is also suitable for more irregular building forms. This method not only addresses energy optimization but also considers the reasonableness and applicability of the generated functional layout schemes, enhancing the reference value of the results for designers. In contrast to forward workflow methods, this approach offers the capability to find globa optimal solutions within a broad design space, providing a new perspective for energy-efficient building design.
There are certain limitations and opportunities for future research. The current scoring criteria may not fully meet the requirements for evaluating and constraining complex elements in architectural design. Future research could explore more suitable and comprehensive evaluation methods. Additionally, further investigation could delve into more detailed factors of building functional layouts and their impact under different climatic conditions.
CRediT authorship contribution statement
Peiying Huang: Writing – original draft, Visualization, Validation, Software, Methodology, Investigation, Conceptualization. Xing Zheng: Writing – review & editing, Validation, Project administration, Meth odology, Conceptualization. Yi Zhang: Supervision, Resources, Formal analysis, Data curation. Pengyuan Shen: Writing – review & editing, Writing – original draft, Supervision, Project administration, Methodology, Funding acquisition, Conceptualization.
Declaration of competing interest
The authors declare that they have no known competing financial interests or personal relationships that could have appeared to influence the work reported in this paper.
Acknowledgement
This work is supported by the Shenzhen Fundamental Research Program (No. JCYJ20250604180231041).
Appendix
Appendix 1 People activity schedule and electrical equipment schedule
Appendix 2 Lighting schedule
Appendix 3 Cooling and heating schedule
Data availability
Data will be made available on request.
References
[1] I.E. Agency, Buildings, in: International Energy Agency, Routledge, n.d.
[2] T.L. Hemsath, Conceptual energy modeling for architecture, planning and design: Impact of using building performance simulation in early design stages, (2013).
[3] M.P. Tootkaboni, I. Ballarini, V. Corrado, Towards climate resilient and energyefficient buildings: a sensitivity analysis on building components and cooling strategies, Build. Environ. 270 (2025) 112473.
[4] X. Gao, Y. Ji, P. Shen, A comparative study of radiant floor heating strategies for passive house in severely cold regions: a case study of Harbin, Energy 323 (2025) 135825.
[5] S. Li, M. Wang, P. Shen, X. Cui, L. Bu, R. Wei, L. Zhang, C. Wu, Energy saving and thermal comfort performance of passive retrofitting measures for traditional rammed earth house in Lingnan, China, Buildings 12 (10) (2022) 1716.
[6] L. Yu, C. Lin, W. Gu, X. Zheng, Y. Zhang, P. Shen, Passive design strategies for curtain wall system in subtropical office buildings in China considering multisensory comfort, Energy and Built Environment (2026)
[7] P. Shen, Y. Li, X. Gao, S. Chen, X. Cui, Y. Zhang, X. Zheng, H. Tang, M. Wang, Climate adaptability of building passive strategies to changing future urban climate: a review, Nexus 2 (2) (2025) 1 13.
[8] P. Huang, Y. Yang, W. Gao, X. Zheng, P. Shen, Climate-adaptive building design through explainable AI: 3D spatial layout automation and evolutionary optimization across climate zones, J. Build. Eng. 115028 (2025)
[9] F. Kheiri, A review on optimization methods applied in energy-efficient building geometry and envelope design, Renew. Sustain. Energy Rev. 92 (2018) 897–920.
[10] R. Pacheco, J. Ordo´nez, ˜ G. Martínez, Energy efficient design of building: a review, Renew. Sustain. Energy Rev. 16 (6) (2012) 3559–3573.
[11] T.L. Hemsath, K. Alagheband Bandhosseini, Sensitivity analysis evaluating basi building geometry's effect on energy use, Renew. Energy 76 (2015) 526 538.
[12] T. Du, S. Jansen, M. Turrin, A. van den Dobbelsteen, Effects of architectural space layouts on energy performance: a review, Sustainability 12 (5) (2020).
[13] T. Du, S. Jansen, M. Turrin, A.V.D. Dobbelsteen, Effect of space layouts on th energy performance of office buildings in three climates, J. Build. Eng. 39 (2021).
[14] H. Latha, S. Patil, P.G. Kini, Influence of architectural space layout and building perimeter on the energy performance of buildings: a systematic literature review, Int. J. Energy Environ. Eng. 14 (3) (2022) 431–474.
[15] F. Musau, K.J.A.S.R. Steemers, Space planning and energy efficiency in office buildings: the role of spatial and temporal diversity, 51 (2) (2008) 133-145.
[16] P. Shen, Building retrofit optimization considering future climate and decision making under various mindsets, J. Build. Eng. 96 (2024) 110422.
[17] M. Alhammad, M. Eames, R. Vinai, Enhancing building energy efficiency through building information modeling (BIM) and building energy modeling (BEM) integration: a systematic review, Buildings 14 (3) (2024) 581.
[18] S. Jiang, M. Wang, L. Ma, Gaps and requirements for applying automatic architectural design to building renovation, Autom. Constr. 147 (2023).
[19] Z. Li, H. Chen, B. Lin, Y. Zhu, Fast bidirectional building performance optimization at the early design stage, Build. Simul. 11 (4) (2018) 647–661.
[20] B. Ekici, C. Cubukcuoglu, M. Turrin, I.S. Sariyildiz, Performative computational architecture using swarm and evolutionary optimisation: a review, Build. Environ. 147 (2019) 356–371.
[21] P. Nourian, S. Rezvani, S. Sariyildiz, Designing with Space Syntax: a configurative approach to architectural layout, proposing a computational methodology, in: R. Stouffs, S. Sariyildiz (Eds.), 31st International Conference on Education and Research in Computer Aided Architectural Design in Europe, eCAADe 2013, Education and research in Computer Aided Architectural Design in Europe, 2013, pp. 357–365.
[22] C. Cubukcuoglu, P. Nourian, M.F. Tasgetiren, I.S. Sariyildiz, S. Azadi, Hospital layout design renovation as a quadratic assignment problem with geodesic distances, J. Build. Eng. 44 (2021) 102952.
[23] L. Wang, Optimization-aided design: two approaches for reflective exploration of design search space, Int. J. Archit. Comput. 20 (4) (2022) 758 776.
[24] J. Michalek, P. Papalambros, Interactive design optimization of architectura layouts, Eng. Optim. 34 (5) (2002) 485–501.
[25] J. Michalek, R. Choudhary, P. Papalambros, Architectural layout design optimization, Eng. Optim. 34 (5) (2002) 461–484.
[26] E. Rodrigues, A.R. Gaspar, A. ´ Gomes, An evolutionary strategy enhanced with a local search technique for the space allocation problem in architecture, Part 2: validation and performance tests, Comput. Aided Des. 45 (5) (2013) 898–910.
[27] E. Rodrigues, A.R. Gaspar, A. ´ Gomes, Automated approach for design generation and thermal assessment of alternative floor plans, Energ. Buildings 81 (2014) 170 181.
[28] Y. Schwartz, R. Raslan, I. Korolija, D. Mumovic, Integrated building performance optimisation: coupling parametric thermal simulation optimisation and generativ
spatial design programming, in: Building Simulation 2017, IBPSA, 2017, pp. 1222- 1229.
[29] J. Zhang, N. Liu, S. Wang, A parametric approach for performance optimization of residential building design in Beijing, Build. Simul. 13 (2) (2019) 223–235.
[30] H. Yi, Y.K. Yi, T. Chan, Performance Based Architectural design optimization Automated 3D space Layout using simulated annealing, in: Proceedings of the 2014 ASHRAE/IBPSA-USA Building Simulation Conference, Atlanta, GA, USA, 2014, pp. 10-12.
[31] H. Yi, User-driven automation for optimal thermal-zone layout during space programming phases, Archit. Sci. Rev. 59 (4) (2015) 279 306.
[32] T. Du, M. Turrin, S. Jansen, A. van den Dobbelsteen, F. De Luca, Relationship analysis and optimisation of space layout to improve the energy performance of office buildings, Energies 15 (4) (2022).
[33] I.G. Dino, G. Üçoluk, An evolutionary approach for 3D architectural space layout design exploration, Autom. Constr. 69 (2016) 131–150.
[34] I.G. Dino, G. Üçoluk, Multiobjective design optimization of building space layout, energy, and daylighting performance, J. Comput. Civ. Eng. 31 (5) (2017).
[35] F. Halawa, S.C. Madathil, M.T. Khasawneh, Multi-objective unequal area podstructured healthcare facility layout problem with daylight requirements, Comput. Ind. Eng. 162 (2021).
[36] C.A.C. Coello, Evolutionary algorithms for solving multi-objective problems, Springer, 2007.
[37] A. Toutou, M. Fikry, W. Mohamed, The parametric based optimization framework daylighting and energy performance in residential buildings in hot arid zone, Alex. Eng. J. 57 (4) (2018) 3595–3608.
[38] M. Manni, G. Lobaccaro, N. Lolli, R.A. Bohne, Parametric design to maximize solar irradiation and minimize the embodied GHG emissions for a ZEB in nordic and mediterranean climate zones, Energies 13 (18) (2020).
[39] P.J.A.B. Nourian, Architecture, t.B. Environment, Configraphics: graph theoretical methods for design and analysis of spatial configurations, (14) (2016) 1–348.
[40] M. Ahmed, R. Seraj, S.M.S. Islam, The k-means algorithm: a comprehensive surve and performance evaluation, Electronics 9 (8) (2020).
[41] Y. Sato, K. Izui, T. Yamada, S. Nishiwaki, Pareto frontier exploration in multiobjective topology optimization using adaptive weighting and point selection schemes, Struct. Multidiscip. Optim. 55 (2) (2016) 409–422.
[42] D.V. Carvalho, E.M. Pereira, J.S. Cardoso, Machine learning interpretability: a survey on methods and metrics, Electronics 8 (8) (2019).
[43] R. Dwivedi, D. Dave, H. Naik, S. Singhal, R. Omer, P. Patel, B. Qian, Z. Wen, T. Shah, G. Morgan, R. Ranjan, Explainable AI (XAI): core ideas, techniques, and solutions, ACM Comput. Surv. 55 (9) (2023) 1–33.
[44] S. Lundberg, S.-I. Lee, A unified approach to interpreting model predictions. In: 31st Conference on Neural Information Processing Systems, 2017.
Fig. 1. Framework of energy saving building space layout generation and optimization.
Publication Details
Journal
Energy and Buildings
Publication Year
2026
Authors
Peiying Huang, Xing Zheng, Yi Zhang, Pengyuan Shen
Categories
Optimization and decision making for building energy efficiency strategies